.svg)

Aug-2026
Sales
Trend
6-Month
Product Count
SKUs
Avg Price
YoY Sales Change
YoY Price Change


Where to Buy
Higher Cultures is stocked at 277 licensed dispensaries across Oregon and New Mexico, 233 of them in Oregon, with the deepest coverage in Portland, Salem, Medford, Bend, and Beaverton. Search by ZIP code or city below to find the closest one, or filter by product type if you are after a specific format.
Market Insights Snapshot
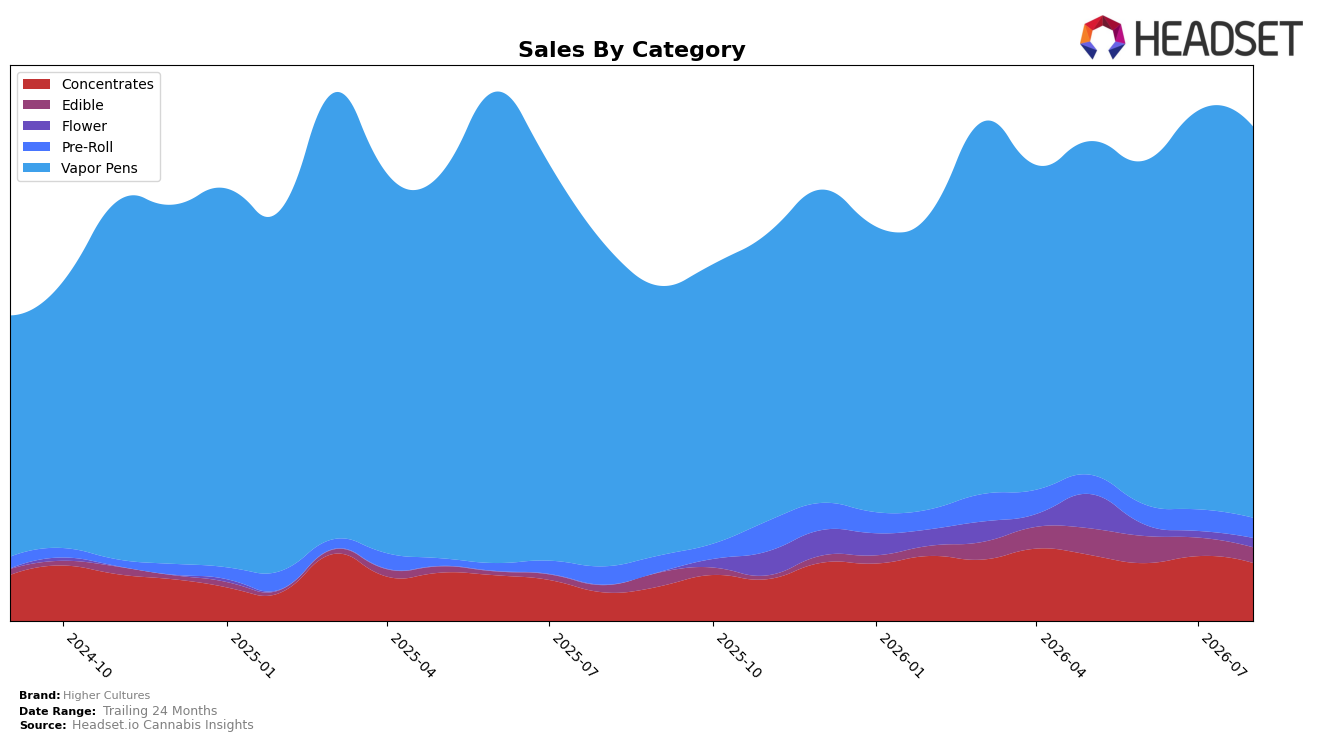
In August 2026, Higher Cultures concentrated 79.39% of sales in Vapor Pens with a 21.21% year-over-year increase but a 2.01% month-over-month decline, while Concentrates held 11.67% share with 104.26% year-over-year growth and a 10.87% month-over-month drop; Pre-Roll at 4.01% rose 10.19% year-over-year but fell 6.85% month-over-month. Edible expanded 123.46% year-over-year to 3.11% share yet contracted 15.23% month-over-month, and Flower, though only 1.82% share, jumped 44.37% month-over-month with no year-over-year baseline; together with a 7.85% year-over-year price decrease and a 31.16% year-over-year brand sales lift, the mix points to unit-led expansion amid short-term category pullbacks. With Vapor Pens ranked 9 in Oregon and average Vapor Pen pricing at $23.39 against a brand average price of $19.95, the brand’s revenue remains anchored in a high-penetration segment while peripheral categories contribute outsized year-over-year growth but add volatility month to month; the pattern implies deliberate share defense in Vapor Pens while using price elasticity to accelerate trial in smaller formats.
The divergence between double- and triple-digit year-over-year growth in Concentrates (104.26%) and Edible (123.46%) versus their month-over-month declines of 10.87% and 15.23% implies promotion- or launch-driven spikes that require sustained assortment and pricing cadence, while Vapor Pens’ 2.01% month-over-month dip alongside a 21.21% year-over-year gain suggests stable core demand with seasonal softness. Coupled with a 44.37% month-over-month rise in Flower from a 1.82% share base and a 7.85% year-over-year brand-wide price reduction, the positioning tilts toward traffic-building price points that trade customers into the Vapor Pens core, indicating a funnel strategy where smaller categories serve as acquisition and cross-sell engines rather than primary share drivers.
Competitive Landscape
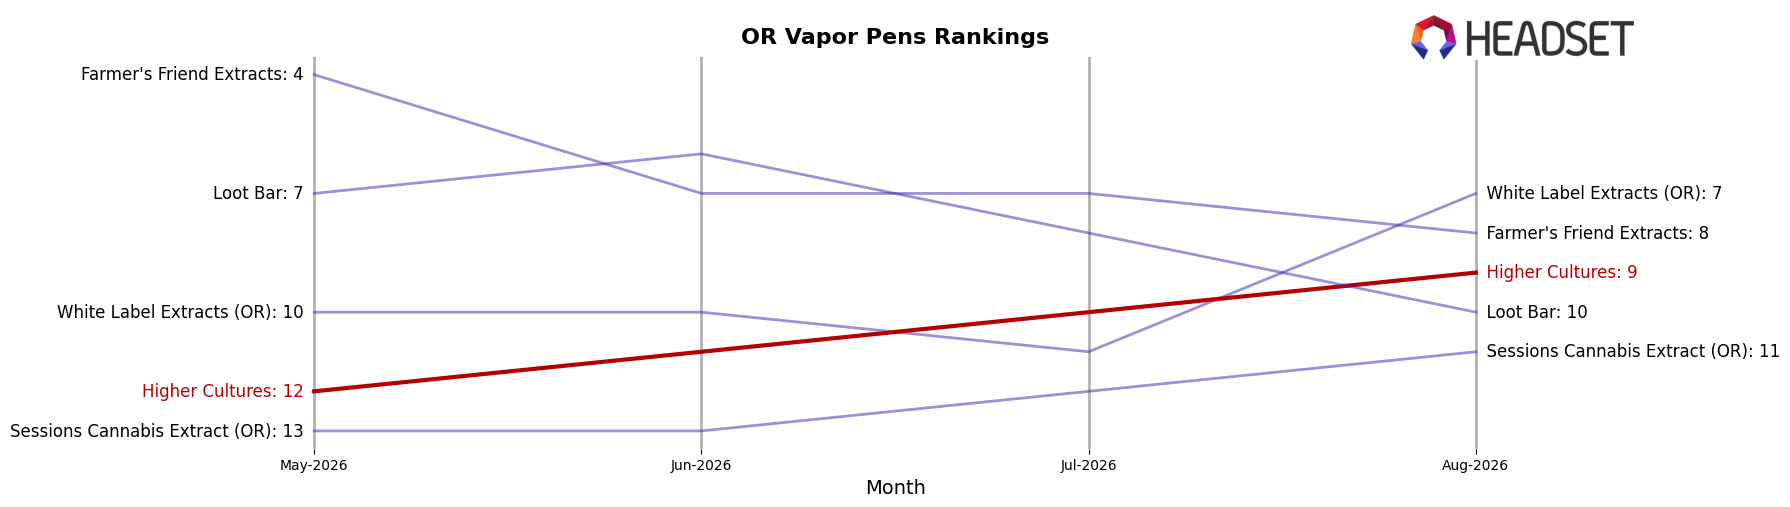
Higher Cultures sits at rank #9 in OR Vapor Pens for August 2026, improving 3 positions year over year from #12 while holding flat versus May 2026 at #12 over the last three months, and this sits below its peak of #6 from June 2025. Competitive movement suggests pressure from leaders: Buddies climbed from #2 to #1 with a 3.2% YoY sales uptick, while Entourage Cannabis / CBDiscovery slipped from #1 to #2 with a 24.5% YoY decline; mid-pack, Mule Extracts rose from #4 to #3 (+9.7%) as Hellavated moved from #3 to #4 (-3.0%). The combination of a 3-rank YoY gain to #9 and a prior peak at #6 implies recovery potential exists but that re-entering the top 5 will require outpacing mid-tier climbers that are posting single-digit to low double-digit growth.
Notable Products
Yumberry High Dose Gemmies 10-Pack (100mg) posted the steepest movement in August 2026 with a -30.0% month-over-month decline while falling to rank 6, and Kiwi Limeade Gummies 10-Pack (100mg) dropped -17.6% at rank 3, indicating a broad pullback in Edibles where four of the top ten are Gummies SKUs. Magic Melon Flavored Distillate Cartridge (1g) countered with a +42.7% month-over-month rise to rank 1, whereas Magic Melon Flavored Distillate Disposable (2.5g) slid -32.2% at rank 9, showing demand consolidating into cartridges over disposables within Vapor Pens. Rocket Pop Flavored Distillate Disposable (2.5g) also declined -23.6% at rank 8, while Blueberry Muffin Live Resin HTE Cartridge (1g) held rank 5 on $17,932 despite no month-over-month read, suggesting value is accruing to higher quality or familiar 1g cartridges over larger disposable formats. The pattern implies Higher Cultures is shifting mix toward flagship 1g cartridges while Gummies and larger disposable formats retreat, prioritizing repeatable inhalable experiences over impulse edible and high-capacity pen options.
Top Selling Cannabis Brands






Data for this report comes from real-time sales reporting by participating cannabis retailers via their point-of-sale systems, which are linked up with Headset’s business intelligence software. Headset’s data is very reliable, as it comes digitally direct from our partner retailers. However, the potential does exist for misreporting in the instance of duplicates, incorrectly classified products, inaccurate entry of products into point-of-sale systems, or even simple human error at the point of purchase. Thus, there is a slight margin of error to consider. Brands listed on this page are ranked in the top twenty within the market and product category by total retail sales volume.

