.svg)
Sep-2026
Sales
Trend
6-Month
Product Count
SKUs
Avg Price
YoY Sales Change
YoY Price Change


Market Insights Snapshot
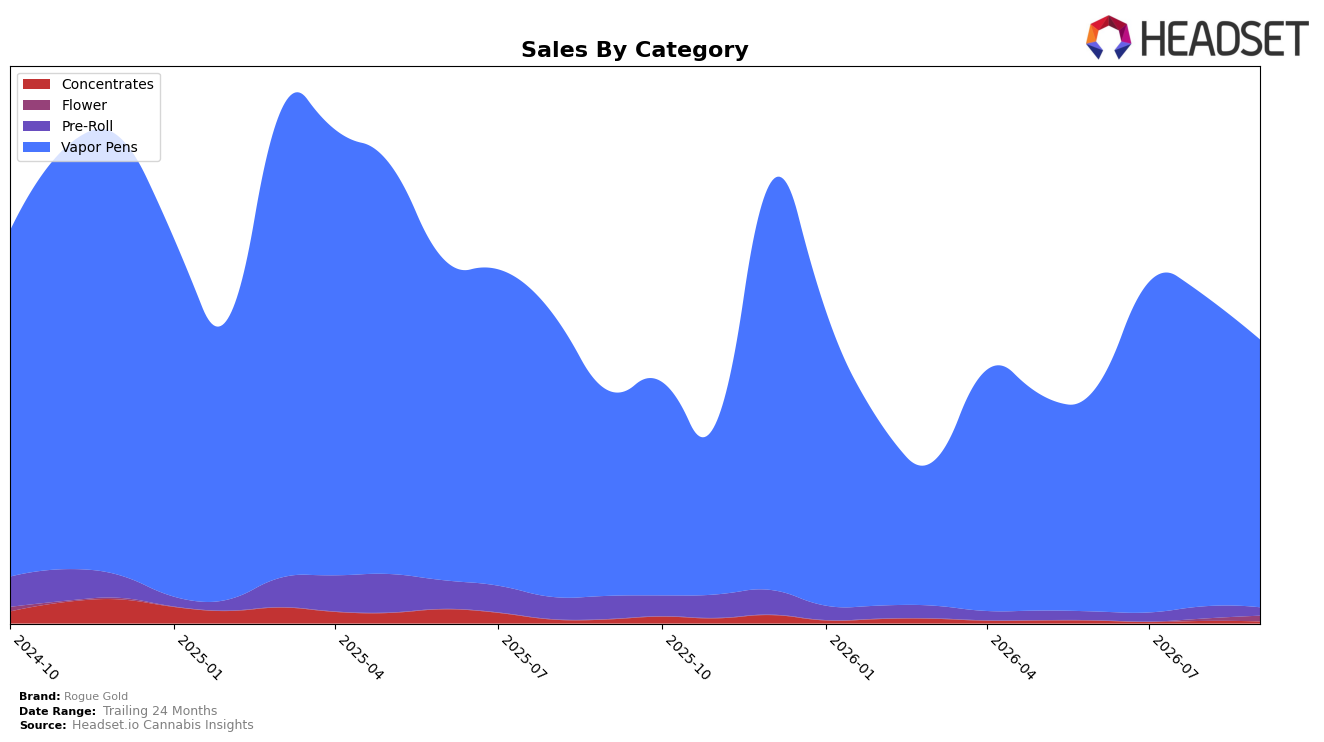
Rogue Gold’s September 2026 mix concentrated 94.71% of sales in Vapor Pens with a year-over-year change of 30.48% but a month-over-month decline of 13.79%, while Pre-Roll fell 65.07% year over year and 32.65% month over month to 2.81% share. Flower, despite a small 1.89% share, surged 171.64% month over month, and Concentrates contracted 55.14% year over year and 25.81% month over month to 0.59% share; combined with a 36.44% average price increase and a 22.05% brand-level year-over-year lift, the pattern suggests the brand is leaning into higher-price Vape offerings while trimming breadth in lower-velocity segments.
With Vapor Pens anchoring the portfolio at 94.71% share and a rank of 19 in Oregon Vapor Pens, the 13.79% month-over-month dip alongside a 30.48% year-over-year rise implies a seasonal or promo-driven pullback rather than structural demand loss, while the 171.64% month-over-month jump in Flower at a $52.56 average price indicates a test of premium positioning. Given a 26.57% two-year sales decline but a 22.05% year-over-year rebound, the mix shift toward high-price Vapes and exploratory premium Flower points to a consolidation strategy aimed at defending category rank and margin per unit rather than regaining broad category footprint in the near term.
Competitive Landscape
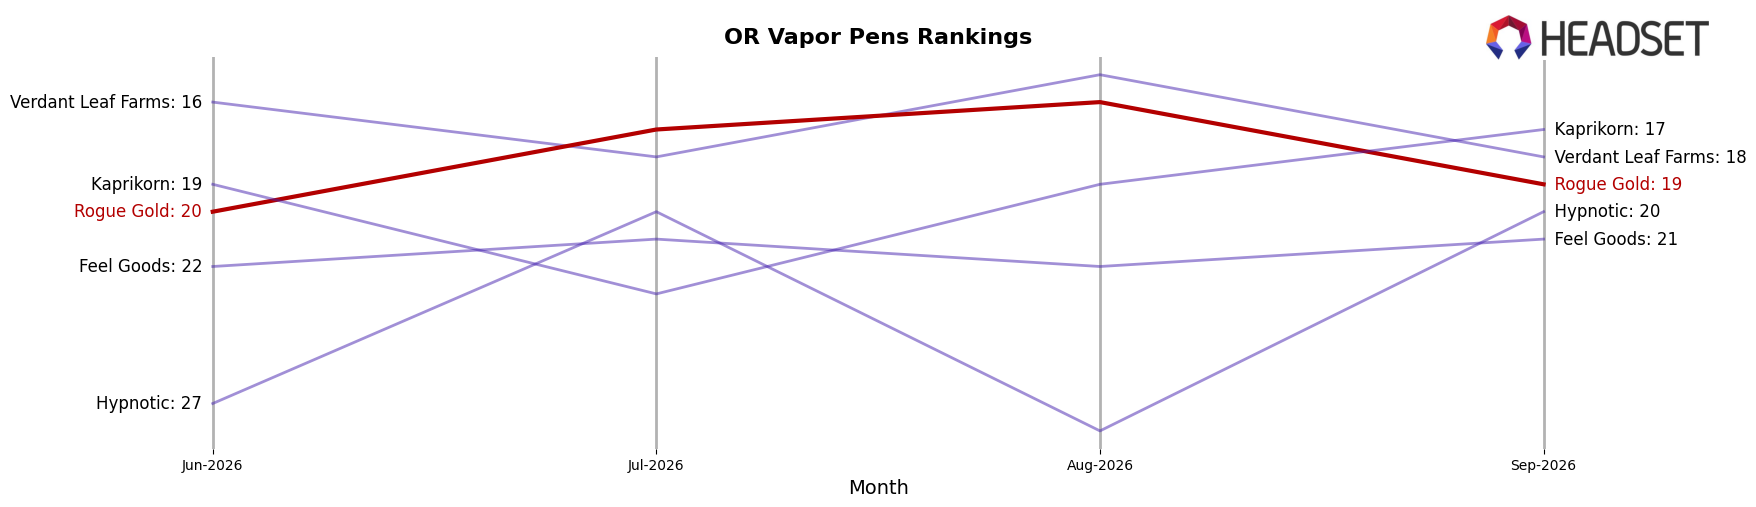
Rogue Gold sits at rank #19 in OR Vapor Pens in September 2026, improving 5 positions from #24 year over year, while slipping 1 place from #20 in June 2026; this sits below its peak of #13 reached in April 2025 and trails category leaders where Entourage Cannabis / CBDiscovery held #1 both this year and last despite a -15.2% YoY sales change and FRESHY climbed from #5 to #3 on +5.1% YoY sales. Compared with Hellavated, which moved down from #3 to #5 alongside a -6.1% YoY sales shift, Rogue Gold’s rise from #24 to #19 alongside a short-term dip from #20 to #19 suggests momentum is recovering on a yearly basis but lacks sustained month-to-month acceleration needed to close the gap with faster risers.
Notable Products
Purple Lemon Cherry x Martian Cookie Infused Pre-Roll (1g) posted the steepest movement in September 2026 with a -59.7% MoM drop while holding rank 4, contrasting with Ice Cream Cake Distillate Disposable (2g) at rank 2 on a +15.4% MoM rise and Green Apple Flavored Distillate Disposable (2g) at rank 1 with $24,705 in sales. Four of the top ten are Vapor Pens at ranks 1, 2, 3, and 5, and two additional Vapor Pens at ranks 6 and 7 declined by -16.1% and -11.8% respectively, while Alien OG Distillate Disposable (2g) at rank 8 slid -39.6%. The pattern implies Rogue Gold is consolidating around Vapor Pens leadership even as select SKUs cycle down, using breadth at high ranks to buffer category volatility.
Top Selling Cannabis Brands






Data for this report comes from real-time sales reporting by participating cannabis retailers via their point-of-sale systems, which are linked up with Headset’s business intelligence software. Headset’s data is very reliable, as it comes digitally direct from our partner retailers. However, the potential does exist for misreporting in the instance of duplicates, incorrectly classified products, inaccurate entry of products into point-of-sale systems, or even simple human error at the point of purchase. Thus, there is a slight margin of error to consider. Brands listed on this page are ranked in the top twenty within the market and product category by total retail sales volume.

