.svg)


Where to Buy
Highland Goat is stocked at 12 licensed dispensaries across New York, with the deepest coverage in New York, Brooklyn, Kingston, Mount Vernon, and New Rochelle. Search by ZIP code or city below to find the closest one.
Market Insights Snapshot
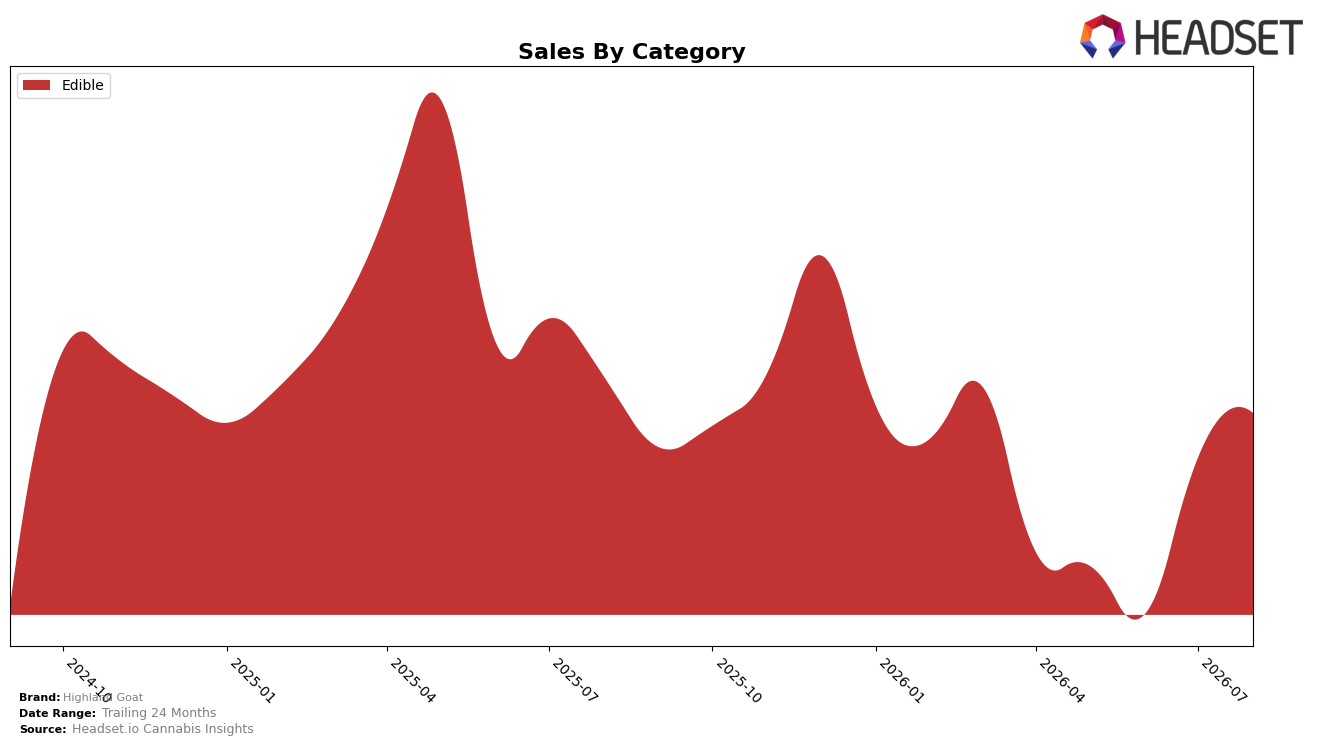
In August 2026, Highland Goat operated as a single-category brand, with Edible accounting for 100.0% of sales and posting a 13.23% month-over-month lift alongside an -8.67% year-over-year decline; average price decreased -1.05% YoY to $34.08 while the brand held a New York Edible rank of 41. The combination of full Edible concentration at 100.0% share and a 13.23% MoM rise against an -8.67% YoY contraction indicates a rebound that is tactical rather than structural, implying that recent demand or promotional cadence lifted near-term volumes without yet reversing the annual trajectory.
With a statewide category rank of 41 in New York and a 100.0% exposure to Edible, the brand’s positioning leans into depth over breadth, using a -1.05% YoY price move to support volume while relying on a 13.23% MoM upswing to regain momentum despite a -8.67% YoY sales drop. This pattern implies Highland Goat is competing on targeted price elasticity within Edible rather than portfolio diversification, and that stabilizing annual performance will require converting the August 2026 monthly gain into sustained retention within the mid-pack rank tier around position 41.
Competitive Landscape
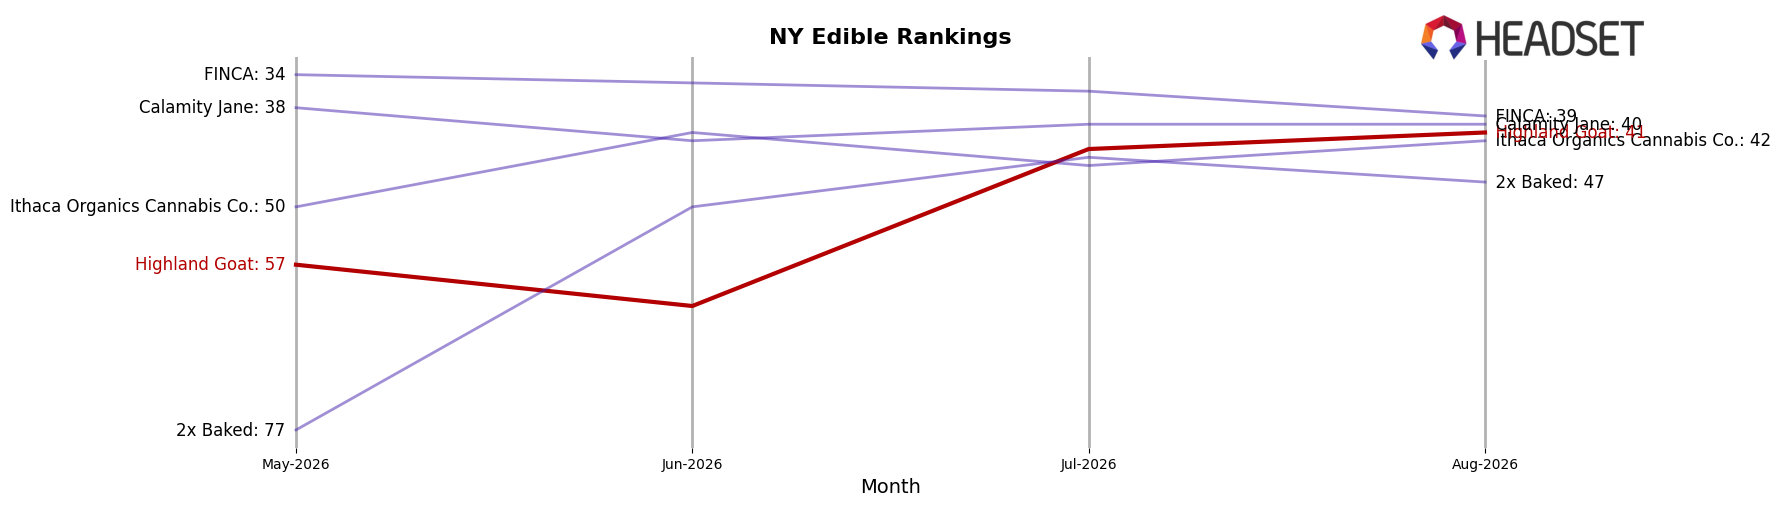
Highland Goat sits at rank #41 in NY Edible in August 2026, down 3 positions from #38 year over year, but up 16 positions from #57 three months ago, indicating a short-term recovery against a longer-term slide from its peak of #28 in May 2025. In contrast, Off Hours fell from #1 to #2 while posting a -24.8% YoY sales change, whereas Gron / Grön climbed from #4 to #3 with +14.8% YoY sales growth; this split signals that momentum is favoring brands gaining share through growth rather than defending legacy rank. With category leaders reshuffling—Camino moved from #2 to #1 and Wyld slipped from #3 to #4—the combination of Highland Goat’s 16-rank rebound since May 2026 and a 3-rank YoY decline implies a fragile mid-pack position that will require sustained monthly share gains to convert a short-term bounce into a durable climb.
Notable Products
Strawberry Lemonade Hash Rosin Gems Gummies 20-Pack (100mg) rose to rank 1 in August 2026 with a 20.8% month-over-month increase, while Hibiscus Lime Hash Rosin Gems Gummies 20-Pack (100mg) held rank 2 with a 3.7% gain, indicating widening separation at the top. With two Edible SKUs occupying ranks 1 and 2, the category concentration suggests an emphasis on confection formats, and the $25,784 result at rank 1 pairs with a rank-2 share that grew more slowly, pointing to a momentum skew toward one hero SKU. The absence of any declines paired with a 17.1 percentage-point gap in MoM growth between the top two signals a product mix pivoting further toward a single flavor-led anchor within Edibles.
Top Selling Cannabis Brands






Data for this report comes from real-time sales reporting by participating cannabis retailers via their point-of-sale systems, which are linked up with Headset’s business intelligence software. Headset’s data is very reliable, as it comes digitally direct from our partner retailers. However, the potential does exist for misreporting in the instance of duplicates, incorrectly classified products, inaccurate entry of products into point-of-sale systems, or even simple human error at the point of purchase. Thus, there is a slight margin of error to consider. Brands listed on this page are ranked in the top twenty within the market and product category by total retail sales volume.

