


Is this your brand?
See your full sales and distribution data: where you sell, how you're priced, and how you rank against the brands next to you on the shelf.
See your brand's dataCarry this brand in your store?
Headset Retailer is free. Connect your POS and see what's selling and what's sitting.
Sign up freeWhere to Buy
The Green Lady Dispensary is stocked at 58 licensed dispensaries across New York and Massachusetts, 56 of them in New York, with the deepest coverage in New York, Queens, Brooklyn, Staten Island, and Binghamton. Search by ZIP code or city below to find the closest one, or filter by product type if you are after a specific format.
Market Insights Snapshot
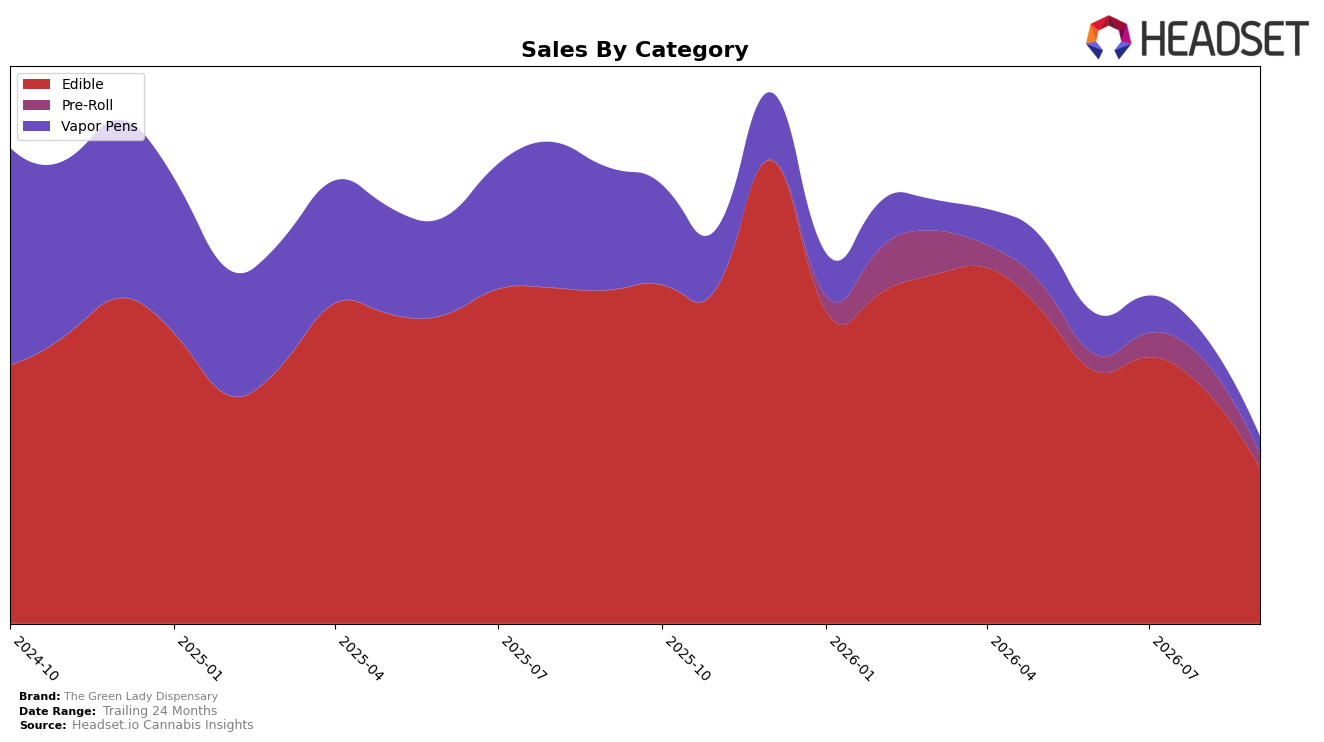
Edible expanded to 83.34% share in September 2026 while contracting by 33.51% month over month and 53.34% year over year, indicating mix consolidation amid volume erosion; Vapor Pens held 9.68% share with a 26.33% MoM drop and an 85.22% YoY decline, further reducing diversification. Pre-Roll accounted for 6.99% share but fell 54.07% MoM, and average price across the brand declined 13.60% YoY to $27.41, compressing revenue alongside a brand-level sales decline of 59.03% YoY. In New York Edible specifically, the brand ranked 37, and Edible’s average price of $26.17 positioned below Vapor Pens at $32.95 and below Pre-Roll at $40.94; the pattern implies the portfolio has tilted toward lower-priced Edible at a time when all three categories are retreating, concentrating risk into one category while sacrificing higher-ticket contributions.
The September 2026 mix suggests The Green Lady Dispensary’s positioning is migrating toward value-led Edible, given Edible’s 83.34% share alongside a 53.34% YoY contraction and a 33.51% MoM dip, while the 85.22% YoY fall in Vapor Pens and the 54.07% MoM slide in Pre-Roll reduce premium and impulse exposure. With brand average price down 13.60% YoY and Edible price sitting at $26.17 against $32.95 for Vapor Pens and $40.94 for Pre-Roll, the implied strategy trades basket size for volume that has not materialized; holding rank 37 in New York Edible during a 59.03% brand-level YoY sales decline points to a need to rebalance toward higher-price formats or defend Edible penetration with differentiated SKUs.
Competitive Landscape
The Green Lady Dispensary sits at rank #37 in NY Edible for September 2026, down 10 positions year over year from #27, and 5 spots below its June 2026 mark of #32. While The Green Lady Dispensary’s peak was #24 in January 2025, it has since ceded ground as Wyld improved from #3 to #2 with a 13.98% year-over-year sales increase and Off Hours fell from #1 to #3 with a 28.14% decline, indicating share is consolidating toward the top two while mid-tier ranks lose stability. The directional gap—slipping 10 ranks YoY and 13 from its historical peak—implies The Green Lady Dispensary is migrating from a volatile mid-tier position toward the lower tier unless near-term execution reverses the three-month slide from #32 to #37.

Notable Products
CBD/THC 1:1 Summer Sangria Chill Gummies 10-Pack (100mg CBD, 100mg THC) posted the steepest decline at -60.6% MoM while sliding to rank 7, and THC/CBN 1:1 Nightcap Sleep Blueberry, Spiced Cinnamon & Chamomile Gummies 10-Pack (100mg THC, 100mg CBN) also fell -12.2% yet remained at rank 1. Five of the top ten are Edible SKUs, and within them two THCV-forward Flirtatious variants sit at ranks 3 and 4 with -35.7% and -34.1% MoM respectively, compared with a nearly flat +0.5% MoM at rank 6 for the Rainbow Z Live Resin Cartridge (1g). This mix signals a pivot in September 2026 toward stabilizing inhalables as gummies fragment, implying assortment and promo recalibration away from breadth in functional Edibles toward a tighter, repeatable set.
Top Selling Cannabis Brands






Data for this report comes from real-time sales reporting by participating cannabis retailers via their point-of-sale systems, which are linked up with Headset’s business intelligence software. Headset’s data is very reliable, as it comes digitally direct from our partner retailers. However, the potential does exist for misreporting in the instance of duplicates, incorrectly classified products, inaccurate entry of products into point-of-sale systems, or even simple human error at the point of purchase. Thus, there is a slight margin of error to consider. Brands listed on this page are ranked in the top twenty within the market and product category by total retail sales volume.

