.svg)


Where to Buy
Honey Green is stocked at 90 licensed dispensaries across Missouri, with the deepest coverage in Kansas City, St. Louis, Columbia, Springfield, and Joplin. Search by ZIP code or city below to find the closest one, or filter by product type if you are after a specific format.
Market Insights Snapshot
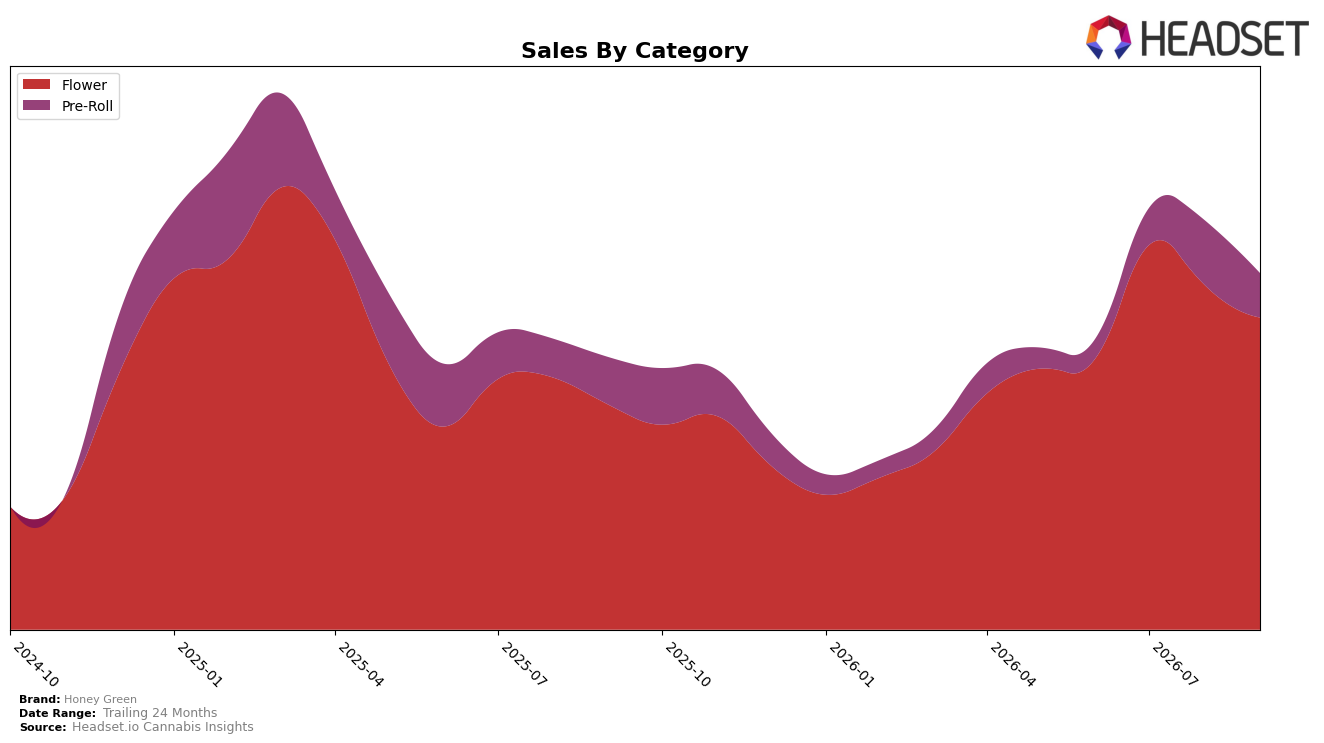
Honey Green’s mix in September 2026 concentrated 87.61% of sales in Flower with 12.39% in Pre-Roll, while Flower’s year-over-year change was 38.74% against a month-over-month decline of 9.45%. Pre-Roll contracted 6.52% year over year and fell 31.54% month over month, with average price at $8.40 versus Flower at $32.25; paired with a 14.99% year-over-year rise in brand average price and a 30.89% brand sales lift, this skew indicates revenue growth leaned on higher-priced Flower even as monthly volumes softened. The net pattern is that September 2026 momentum depended on price/mix in Flower outweighing Pre-Roll retrenchment, which implies exposure to further volatility if Flower’s month-over-month slide persists.
With Flower at 87.61% share and ranked 36 in Flower within Missouri, the brand’s position hinges on stabilizing Flower’s month-over-month –9.45% while converting Pre-Roll’s –31.54% month-over-month into a less negative drag. Given 38.74% year-over-year Flower growth alongside a –6.52% year-over-year in Pre-Roll, the portfolio signals a singular growth engine rather than a balanced two-category hedge; the implication is that pricing power can support rank only to a point, and September 2026 positioning would benefit from buffering Flower cyclicality with targeted Pre-Roll recovery rather than further concentration.
Competitive Landscape
Honey Green sits at rank #36 in September 2026, improving 1 position YoY from #37 and slipping 1 position versus June 2026’s #35; against its historical context, the brand is 10 spots below its March 2025 peak at #26 and 31 places behind the current category leader. Competitive movement is concentrated at the top: Flora Farms held #1 year over year (0-rank change) with approximately 33% YoY sales growth, while Amaze Cannabis climbed from #6 to #2 (+4 ranks) with roughly 20% YoY growth; in contrast, Sinse Cannabis stayed at #3 (0-rank change) despite an 11% YoY sales decline, and Illicit / Illicit Gardens held #4 (0-rank change) with a 9% YoY decline. With Honey Green effectively flat YoY on rank (+1) and marginally lower than its 3-month position (-1), while leaders consolidate or advance at the top, the trajectory implies stabilization in the low-30s tier unless assortment or velocity shifts meaningfully to close the 10-rank gap back to its March 2025 peak.

Notable Products
Lollipop (3.5g) posted the steepest movement in September 2026 with a -55.7% month-over-month drop while sliding to rank 10, contrasting with Coffee Creamer (3.5g) rising +24.5% at rank 1. Four of the top ten are Flower SKUs, and within that group the split between Coffee Creamer (3.5g) at rank 1 and Pineapple Mojito (3.5g) at rank 5 with -3.1% MoM points to concentration at the top and attrition in the long tail. The pattern implies Honey Green is consolidating around a single flagship Flower SKU while legacy Flower variants face pruning pressure.
Top Selling Cannabis Brands






Data for this report comes from real-time sales reporting by participating cannabis retailers via their point-of-sale systems, which are linked up with Headset’s business intelligence software. Headset’s data is very reliable, as it comes digitally direct from our partner retailers. However, the potential does exist for misreporting in the instance of duplicates, incorrectly classified products, inaccurate entry of products into point-of-sale systems, or even simple human error at the point of purchase. Thus, there is a slight margin of error to consider. Brands listed on this page are ranked in the top twenty within the market and product category by total retail sales volume.

