.svg)


Where to Buy
House of Kush is stocked at 52 licensed dispensaries across Maryland, Missouri, and New Mexico, 32 of them in Maryland, with the deepest coverage in Annapolis, Baltimore, Cockeysville, Bethesda, and California. Search by ZIP code or city below to find the closest one, or filter by product type if you are after a specific format.
Market Insights Snapshot
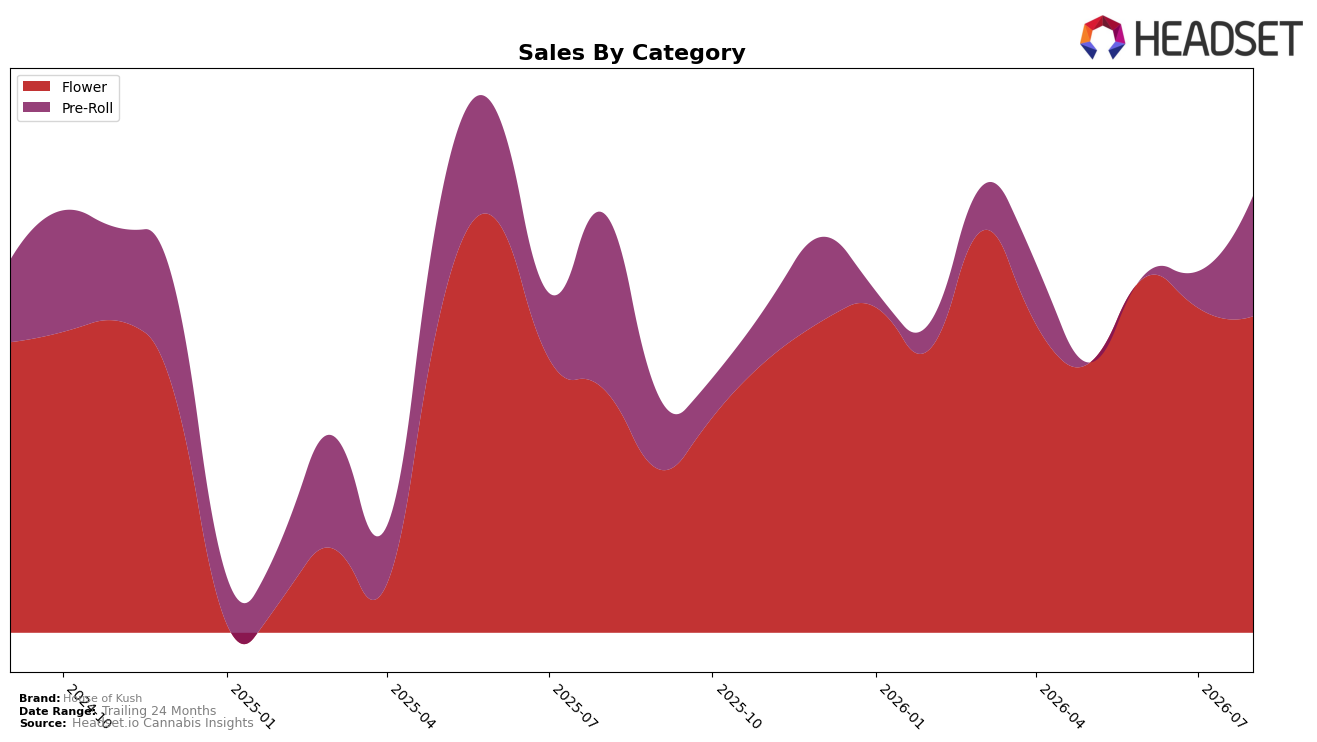
House of Kush’s August 2026 category mix concentrated 68.65% of sales in Flower with year-over-year growth of 25.42% but a month-over-month dip of 2.27%, while Pre-Roll held 31.35% share with a year-over-year decline of 25.20% yet a month-over-month surge of 103.59%. The brand’s average price rose 22.05% year over year to $18.18, whereas the Flower segment carried a higher average price of $28.61 versus $10.11 in Pre-Roll, and the brand ranked 41 in Flower in Maryland. The pattern implies House of Kush is reweighting toward higher-priced Flower despite short-term softness, while the sharp Pre-Roll rebound is tactical rather than a full recovery given the negative year-over-year base.
The divergence—Flower up 25.42% year over year but down 2.27% month over month, versus Pre-Roll down 25.20% year over year but up 103.59% month over month—implies a barbell: premium-led core supported by episodic volume spikes. With 68.65% share anchored in Flower and a rank of 41 in Maryland Flower, the brand’s positioning skews toward price-led value capture in its core while using Pre-Roll promotions to recoup traffic; the thesis is that sustaining overall growth will depend on stabilizing Pre-Roll’s year-over-year deficit without diluting Flower’s price architecture.
Competitive Landscape
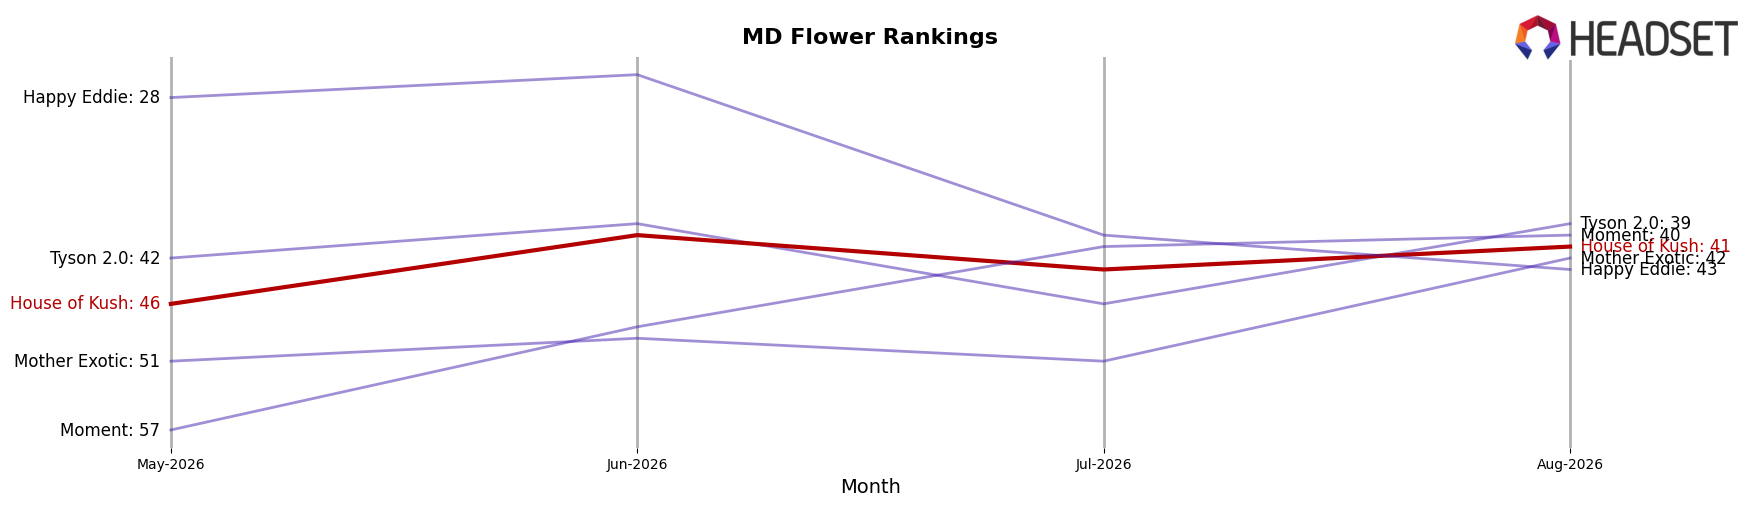
House of Kush sits at rank #41 in August 2026, improving 6 positions from #47 year over year, while moving up 5 spots from #46 in May 2026 to #41 in August 2026; however, the brand remains 2 positions below its peak rank of #39 from August 2024. In contrast, Find. jumped from #29 to #5 year over year with a 526.5% sales increase, and SunMed held at #1 with a 1.1% YoY sales gain, indicating that category momentum is concentrating at the top while mid-pack gains are incremental. The pattern implies that House of Kush’s modest rank recovery, despite a 6-place YoY climb and a 5-place three-month lift, signals stabilization rather than breakout movement in Maryland Flower.
Notable Products
Garlic Cocktail Pre-Roll 2-Pack (1g) posted the steepest movement in August 2026 with a -68.3% month-over-month drop and fell to rank 8, while Red Velvet Kush Pre-Roll 2-Pack (1g) surged +155.3% MoM to rank 1. Animal Cocktail Pre-Roll 2-Pack (1g) advanced +197.1% MoM to rank 2 as Red Velvet Kush (3.5g) declined -13.2% MoM to rank 4, indicating a transfer of share from Flower into Pre-Roll at the very top of the lineup. With three Pre-Rolls inside the top five and two Flower SKUs sliding, the mix points to a deliberate pivot toward value-sized inhalables that can scale volume faster than eighths.
Top Selling Cannabis Brands






Data for this report comes from real-time sales reporting by participating cannabis retailers via their point-of-sale systems, which are linked up with Headset’s business intelligence software. Headset’s data is very reliable, as it comes digitally direct from our partner retailers. However, the potential does exist for misreporting in the instance of duplicates, incorrectly classified products, inaccurate entry of products into point-of-sale systems, or even simple human error at the point of purchase. Thus, there is a slight margin of error to consider. Brands listed on this page are ranked in the top twenty within the market and product category by total retail sales volume.

