May-2026
Sales
Trend
6-Month
Product Count
SKUs
Avg Price
YoY Sales Change
YoY Price Change
Market Insights Snapshot
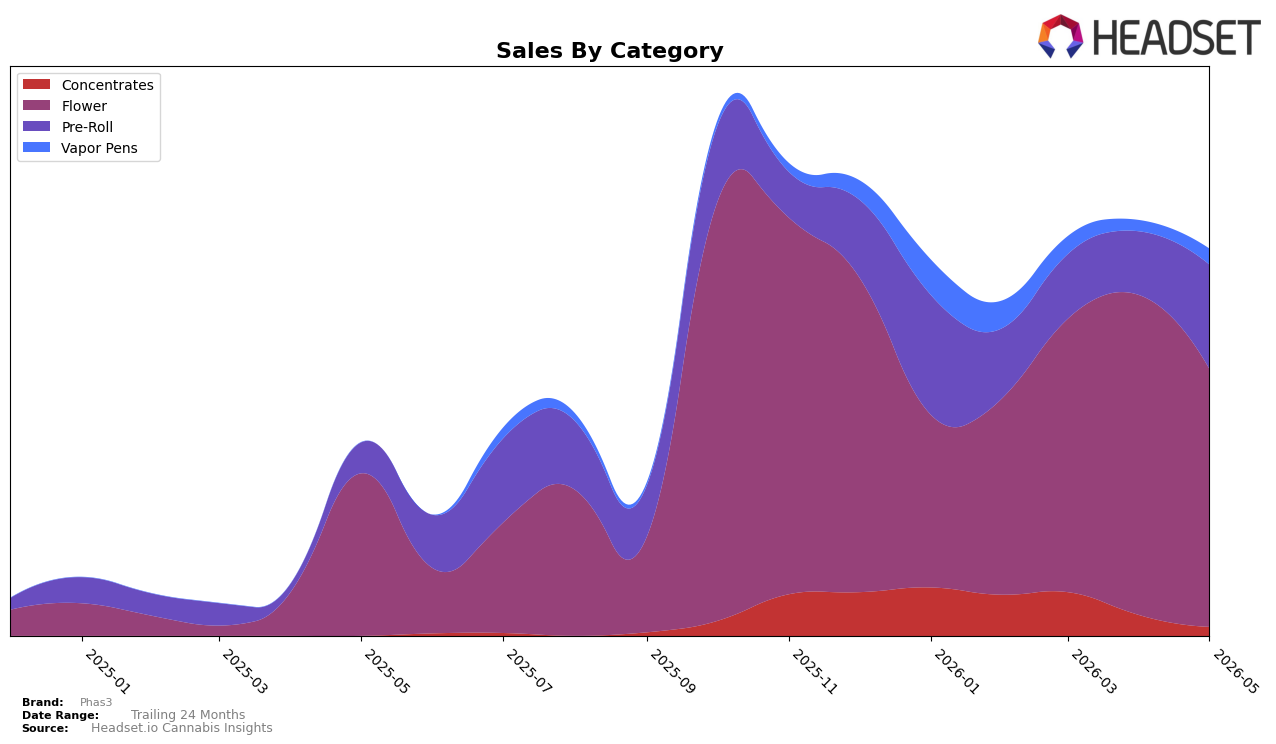
In May 2026, Phas3’s mix concentrated in Flower at 66.67% share with 58.76% year-over-year growth but a 19.44% month-over-month decline, while Pre-Roll expanded to 26.94% share with 240.81% year-over-year and 63.90% month-over-month growth. Vapor Pens, though only 4.06% share, rose 43.57% month-over-month, contrasting with Concentrates at 2.33% share that fell 56.38% month-over-month; this coincided with a 14.17% year-over-year drop in average price and 100.41% brand-level year-over-year sales growth. In Maryland Flower, the brand sat at rank 31, and that position alongside the mix shift implies the brand is reallocating volume from a declining core (Flower down 19.44% month-over-month) toward faster-moving formats (Pre-Roll up 63.90% month-over-month) while using price to accelerate unit velocity.
The tilt toward Pre-Roll and Vapor Pens, together adding 31.00% share with month-over-month lifts of 63.90% and 43.57% respectively, suggests Phas3 is trading some premium per-unit revenue for penetration, as seen in the 14.17% year-over-year average price decline and a simultaneous 100.41% year-over-year sales increase. With Flower still two-thirds of sales and ranked 31 in Maryland, sustaining growth likely depends on continuing to convert Flower shoppers into multi-format buyers while cushioning volatility from Concentrates’ 56.38% month-over-month contraction; the pattern implies a scale strategy built on lower ticket but higher-frequency items to stabilize share while improving depth in non-Flower lanes.
Competitive Landscape
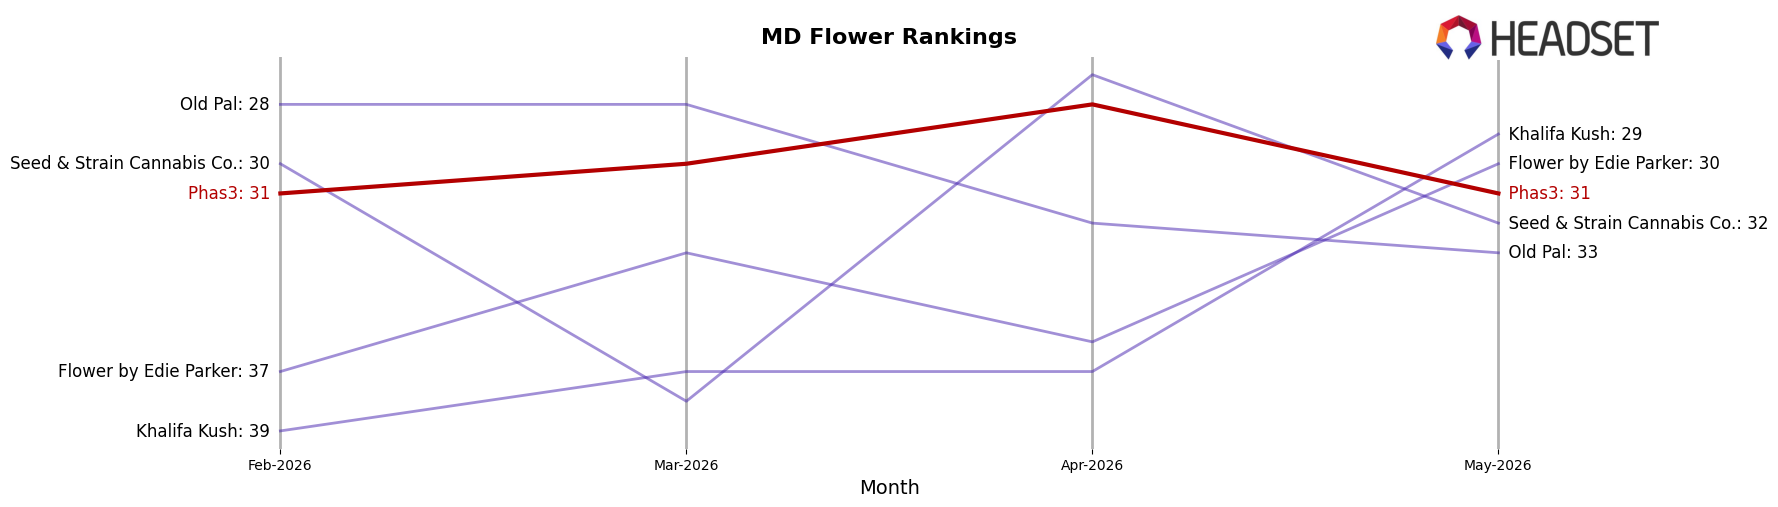
Phas3 is currently ranked #31 in MD Flower in May 2026, improving 7 positions from #38 year over year, while holding flat versus February 2026 at #31; this contrasts with Fade Co. climbing from #3 to #1 and RYTHM slipping from #2 to #3 alongside a -9.05% sales change. Phas3’s trajectory from a peak of #25 in October 2025 to #31 now indicates a 6-rank retreat from its high even as the annual improvement suggests regained footing, and with Strane moving from #8 to #4 on 74.47% YoY sales growth, the brand’s stability at #31 implies it is ceding momentum to faster-advancing rivals and must convert rank maintenance into multi-rank gains to avoid further relative share erosion.
Notable Products
Alaskan Thunder Fuck Pre-Roll 2-Pack (1g) delivered the headline move in May 2026 with a 117.7% month-over-month surge to rank 1, while AK-47 (3.5g) slid 20.8% to rank 4, marking the steepest decline in the top ten. Panama Red (3.5g) also accelerated 67.5% to rank 2, and Pineapple Express Pre-Roll 2-Pack (1g) rose 40.3% at rank 3, with Alaskan Thunder F*ck (3.5g) easing 7.5% at rank 10. Four of the top ten are Pre-Roll SKUs, and their upward skew—117.7% at rank 1 and 40.3% at rank 3—contrasts with mixed Flower trends where gains of 67.5% at rank 2 coexist with a 20.8% drop at rank 4. The pattern implies Phas3 is tilting toward accessible, repeatable formats, using Pre-Roll momentum to offset volatility in mid-ranked Flower SKUs.
Top Selling Cannabis Brands
Data for this report comes from real-time sales reporting by participating cannabis retailers via their point-of-sale systems, which are linked up with Headset’s business intelligence software. Headset’s data is very reliable, as it comes digitally direct from our partner retailers. However, the potential does exist for misreporting in the instance of duplicates, incorrectly classified products, inaccurate entry of products into point-of-sale systems, or even simple human error at the point of purchase. Thus, there is a slight margin of error to consider. Brands listed on this page are ranked in the top twenty within the market and product category by total retail sales volume.

