.svg)
Sep-2026
Sales
Trend
6-Month
Product Count
SKUs
Avg Price
YoY Sales Change
YoY Price Change


Market Insights Snapshot
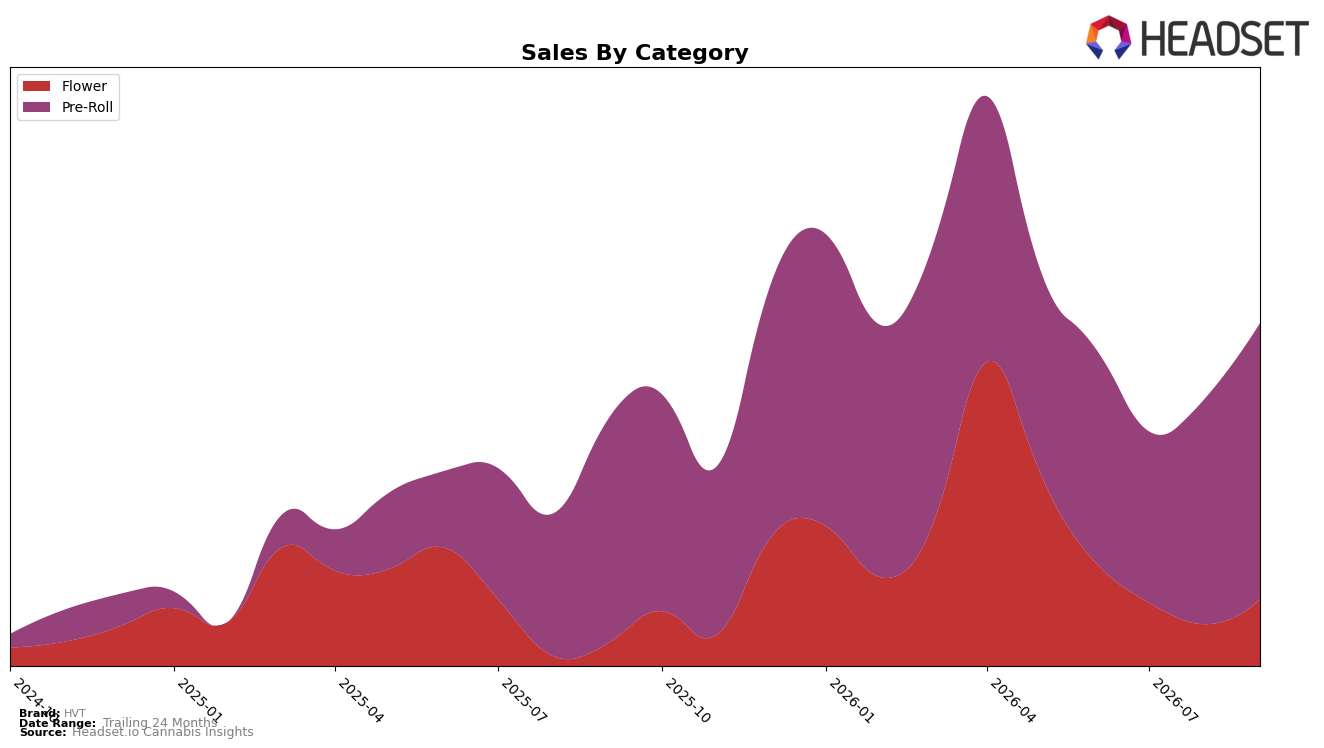
In September 2026, HVT concentrated 77.56% of sales in Pre-Roll with 22.44% in Flower, while overall brand sales rose 33.68% year over year and average price increased 31.32%. Pre-Roll advanced 21.59% YoY and 20.87% MoM with an average price of $29.23, whereas Flower expanded 103.66% YoY and 40.78% MoM at an average price of $50.66; this split implies margin exposure to mix if Flower keeps growing faster than Pre-Roll. With Pre-Roll leading share but Flower outpacing on both YoY and MoM, the mix suggests HVT is tilting toward higher-priced units, and the pattern implies price/pack architecture needs guarding to avoid cannibalizing Pre-Roll velocity as Flower scales.
Given a Pre-Roll rank of 39 in Saskatchewan and a 20.87% MoM gain alongside a 21.59% YoY rise, momentum is present yet constrained relative to faster Flower growth of 40.78% MoM and 103.66% YoY; this points to a portfolio where the growth engine is shifting. With brand sales up 33.68% YoY while Pre-Roll remains three-quarters of mix, sustaining rank improvement will likely depend on leveraging Flower’s >100% YoY expansion without eroding the 77.56% Pre-Roll base, implying a positioning pivot toward premiumized Flower that still feeds Pre-Roll trial through price ladders.
Competitive Landscape
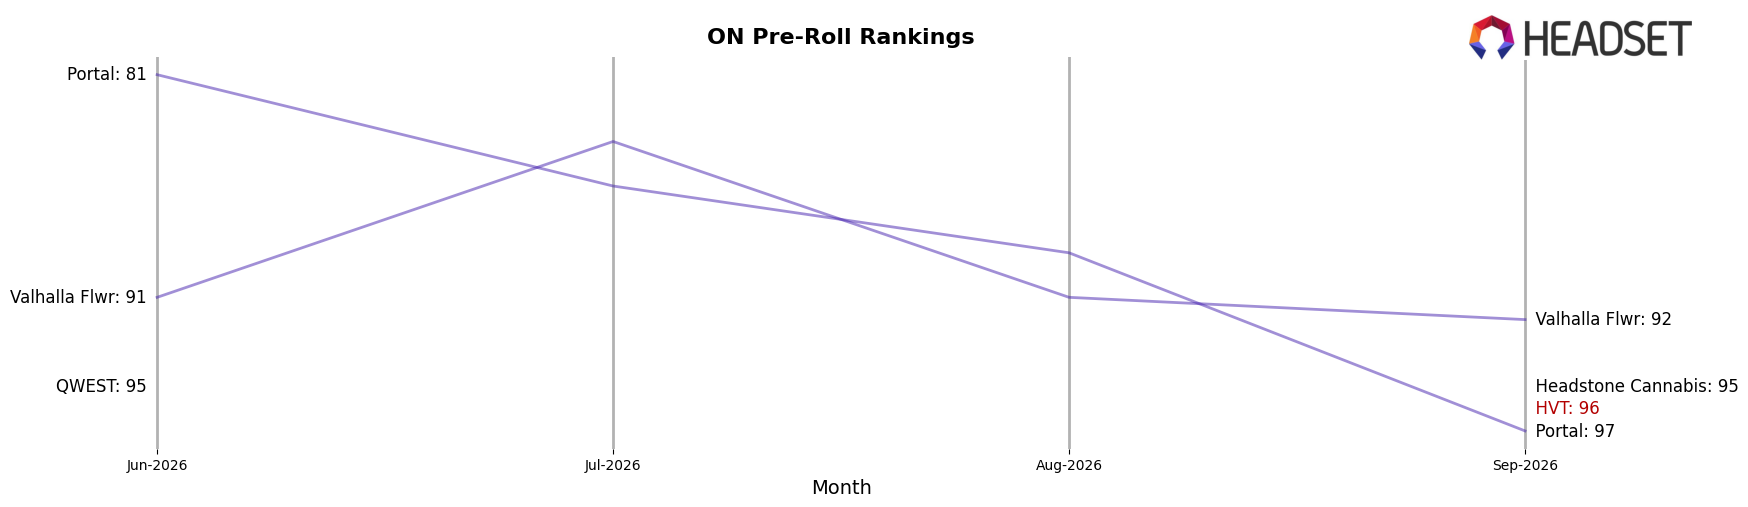
HVT sits at rank #96 in ON Pre-Roll for September 2026, improving 26 positions year over year from #122, while slipping 5 spots from a 3-month rank of #105 and trailing its peak of #91 from April 2026, which frames a modest rebound amid recent softening. Competitive movement was uneven: Back Forty / Back 40 Cannabis advanced from #2 to #1 with 46.6% YoY sales growth, General Admission fell from #1 to #2 alongside a 38.2% YoY sales decline, and Spinach jumped from #17 to #4 with 141.2% YoY growth—indicating that upward mobility is attainable but concentrated among a few fast risers. The combination of a 26-rank YoY gain and a 5-rank slide since June 2026 implies HVT’s trajectory is improving over the long arc but losing momentum quarter-over-quarter, suggesting that maintaining share will require near-term activation against surging climbers.
Notable Products
RS-11 Milled (28g) delivered the largest month-over-month gain at 175.5% and climbed into rank 5, while Dual Z (28g) fell 52.8% to rank 4; this split inside Flower signals a pivot toward milled formats even as traditional ounces contract. Shrapnel Milled (14g) surged 83.4% to rank 2 as Go Time Pre-Roll 10-Pack (5g) held rank 1 with 37.9% growth and $95,059 in September 2026, and two of the top three SKUs are Pre-Roll products, indicating the category still anchors share even as milled Flower accelerates. Souffle x Dante's Inferno Pre-Roll 40-Pack (20g) dropped 13.6% to rank 3 alongside the Pre-Roll leader at rank 1, which implies that value and format variety, rather than the category itself, are driving winners and shaping HVT’s mix toward scalable pack sizes and milled efficiency.
Top Selling Cannabis Brands






Data for this report comes from real-time sales reporting by participating cannabis retailers via their point-of-sale systems, which are linked up with Headset’s business intelligence software. Headset’s data is very reliable, as it comes digitally direct from our partner retailers. However, the potential does exist for misreporting in the instance of duplicates, incorrectly classified products, inaccurate entry of products into point-of-sale systems, or even simple human error at the point of purchase. Thus, there is a slight margin of error to consider. Brands listed on this page are ranked in the top twenty within the market and product category by total retail sales volume.

