.svg)
Aug-2026
Sales
Trend
6-Month
Product Count
SKUs
Avg Price
YoY Sales Change
YoY Price Change


Where to Buy
Jackpot (OR) is stocked at 50 licensed dispensaries across Oregon and Oklahoma, 44 of them in Oregon, with the deepest coverage in Portland, Beaverton, Eugene, Gresham, and Milwaukie. Search by ZIP code or city below to find the closest one, or filter by product type if you are after a specific format.
Market Insights Snapshot
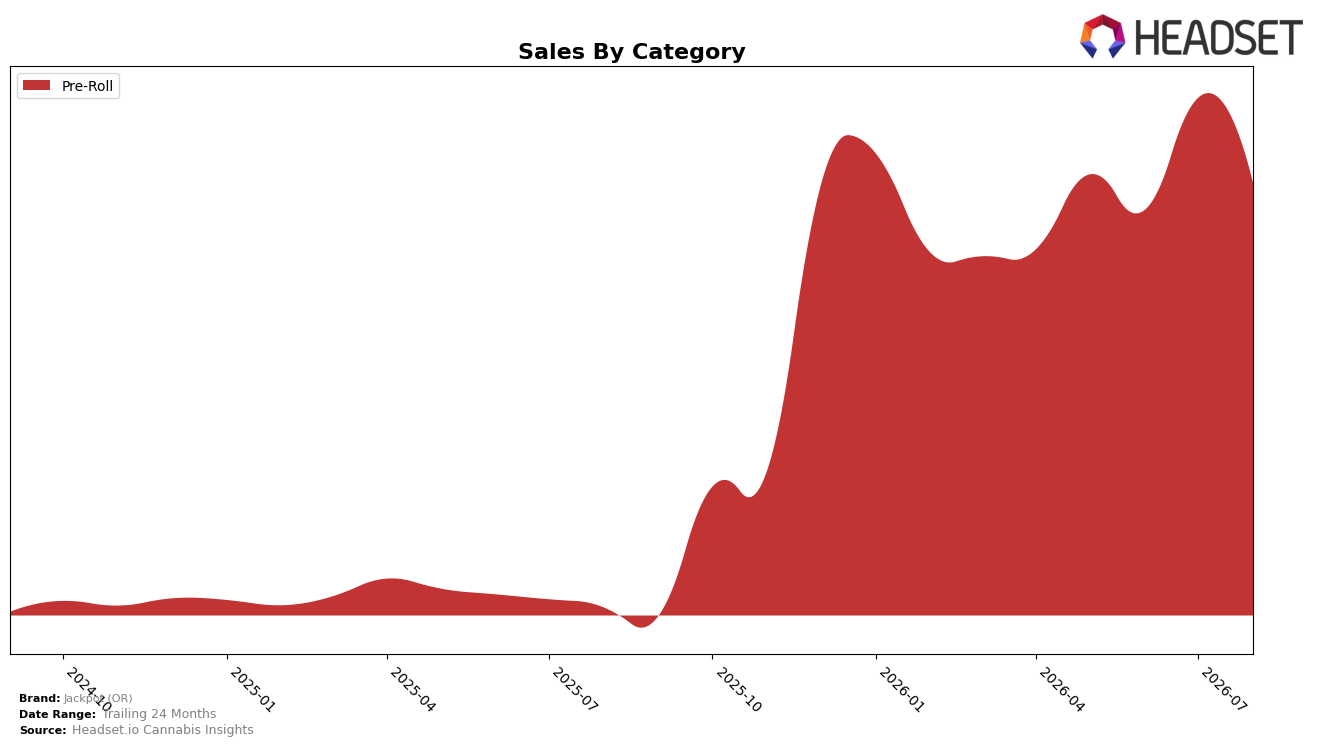
In August 2026, Jackpot (OR) concentrated 100.0% of sales in Pre-Roll, with year-over-year sales up 3642.08% while month-over-month declined 16.29%, and the average price rose 169.43% YoY to $38.53. Within the Saskatchewan Pre-Roll context, the brand sat at rank 21, indicating that the outsized YoY surge is not yet translating into a top-20 placement; the pattern implies a single-category bet that is scaling rapidly YoY but cooling near-term, warranting attention to price elasticity and retention in a rank-competitive lane.
The mix shift toward a sole Pre-Roll focus paired with a 16.29% MoM decline and a 169.43% YoY price increase suggests a repositioning toward premium tiers that expanded revenue YoY but narrowed near-term demand, aligning with rank 21 headroom rather than category leadership. The implication is that Jackpot (OR) can trade price for share in Pre-Roll by moderating the recent price lift or by improving value density, as sustained 3642.08% YoY growth alongside a MoM contraction indicates sensitivity at current price points and a need to convert YoY momentum into improved rank velocity.
Competitive Landscape
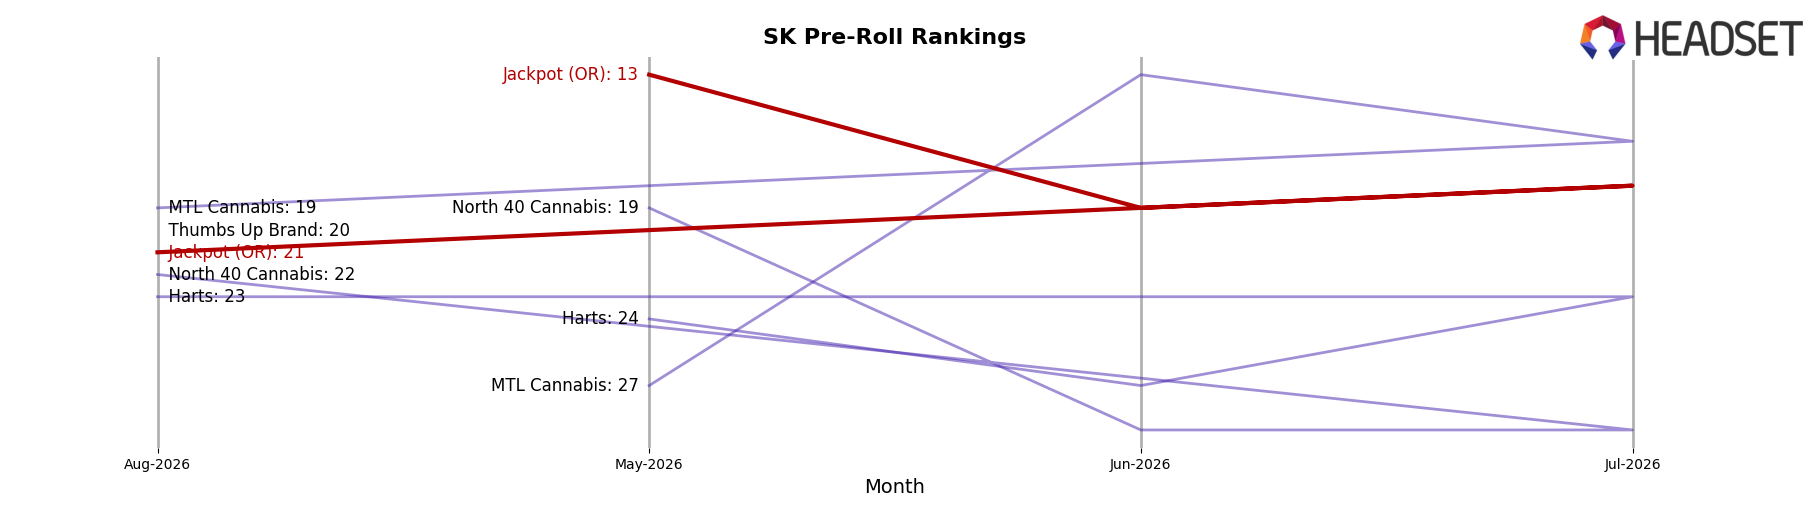
Jackpot (OR) is currently ranked #21 in SK Pre-Roll, falling 8 positions from #13 in May 2026 to #21 in August 2026, while Back Forty / Back 40 Cannabis sits at #1 after a year-over-year rise from #2 and a 172.1% sales increase, and Spinach holds #5 despite a -21.4% sales change and a prior #1 rank; compared with Jackpot (OR)’s three-month slide from #13 to #21 and its peak at #13 in May 2026, competitors such as Doobie Snacks advanced to #2 from #4 alongside 130.9% YoY growth and General Admission moved to #4 from #6 with 51.9% YoY growth, implying that Jackpot (OR)’s rank trajectory signals share leakage from the mid-tier toward faster-growing leaders and leaves limited near-term path back to the top 15 without a reversal in momentum.
Notable Products
Purple Drank Pre-Roll 3-Pack (1.5g) posted the steepest shift in August 2026 with an -84.7% month-over-month drop and slid to rank 3, while the larger Purple Drank Pre-Roll 28-Pack (14g) fell -18.1% and sat at rank 4. In contrast, Orange Tangie Pre-Roll 3-Pack (1.5g) surged +145.1% MoM to rank 2 and trailed the flagship Orange Tangie Pre-Roll 28-Pack (14g), which declined -12.2% at rank 1 and still generated $81,365. With all four top-10 items concentrated in the Pre-Roll category, the divergence between value 3-packs and bulk 28-packs suggests a shift toward smaller trial-oriented formats even as the leading bulk SKU retains the top rank.
Top Selling Cannabis Brands






Data for this report comes from real-time sales reporting by participating cannabis retailers via their point-of-sale systems, which are linked up with Headset’s business intelligence software. Headset’s data is very reliable, as it comes digitally direct from our partner retailers. However, the potential does exist for misreporting in the instance of duplicates, incorrectly classified products, inaccurate entry of products into point-of-sale systems, or even simple human error at the point of purchase. Thus, there is a slight margin of error to consider. Brands listed on this page are ranked in the top twenty within the market and product category by total retail sales volume.

