Jun-2026
Sales
Trend
6-Month
Product Count
SKUs
Avg Price
YoY Sales Change
YoY Price Change
Market Insights Snapshot
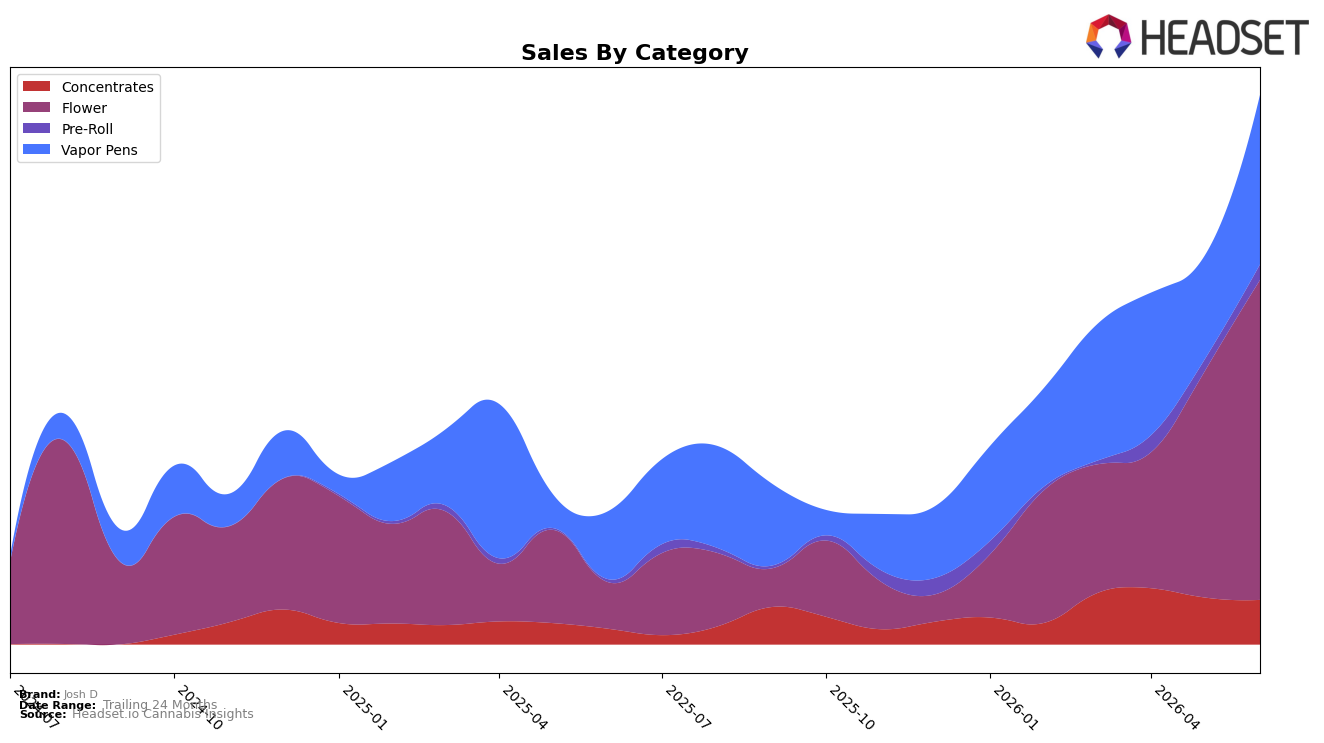
Josh D’s category mix in June 2026 is concentrated in Flower at 58.26% share with 591.05% year-over-year growth and 41.54% month-over-month growth, while Vapor Pens hold 30.84% share with 149.53% YoY and 63.53% MoM growth. Pre-Roll contributes 2.79% share with 468.07% YoY and 31.63% MoM growth, contrasting with Concentrates at 8.11% share that is up 185.62% YoY but down 5.07% MoM. Average price rose 52.96% YoY to $38.49, and Flower’s average price at $51.61 indicates a premium tier relative to Vapor Pens at $30.68, which together suggest the brand is leaning into higher-priced Flower while using faster MoM gains in Vapor Pens to expand reach; the pattern implies a barbell strategy anchored by premium Flower and scaled volume in Vapor Pens.
Positioning-wise, the 41.54% MoM lift in Flower alongside a 63.53% MoM surge in Vapor Pens points to dual momentum that can support shelf visibility even as Concentrates retract 5.07% MoM, and the brand’s rank of 37 in Flower within Ohio sets a reference point for distribution depth. With Flower’s 58.26% share outpacing Vapor Pens’ 30.84% yet Vapor Pens growing faster MoM, the mix implies room to trade Vapor Pen trial into higher-priced Flower; the thesis is that maintaining Flower share above 55% while converting Vapor Pen gains can lift pricing power without overexposing the portfolio to a single category.
Competitive Landscape
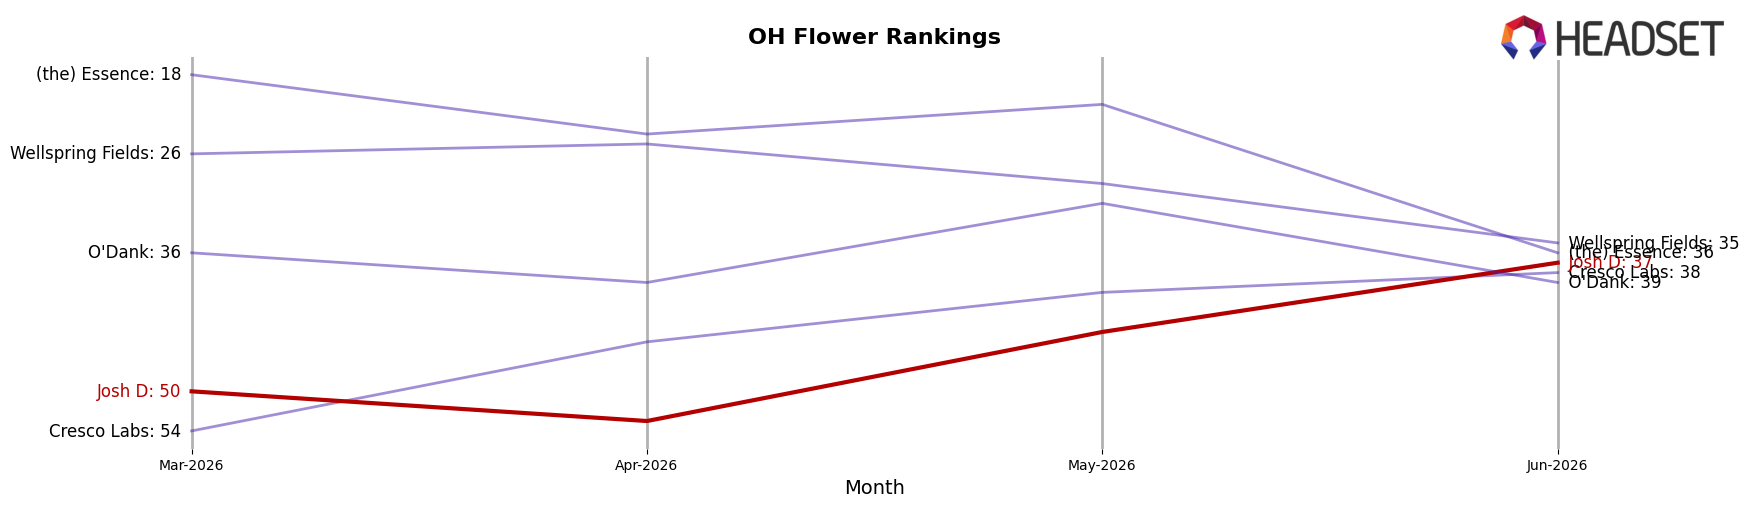
Josh D sits at rank #37 in Ohio Flower in June 2026, a 27-place climb from rank #64 year over year, and a 13-place gain from rank #50 in March 2026; this is also a new peak rank of #37 in June 2026. Against the top tier, Klutch Cannabis rose from #20 to #1 with 304.8% YoY sales growth while Riviera Creek edged from #1 to #2 as sales fell 22.7%, indicating leadership volatility at the top as Josh D advances from the mid-pack. Given the concurrent upward rank shifts over both 3-month (+13 positions) and 12-month (+27 positions) windows, the trajectory implies Josh D is transitioning from a fringe presence toward a stable mid-tier contender, with further gains contingent on converting recent rank momentum into sustained share wins.
Notable Products
Kockeyed (3.5g) posted the largest month-over-month surge at +101.6% to enter June 2026 at rank 6, while Kockeyed Smalls (14.15g) climbed +74.6% to rank 4, indicating a two-tier Flower ladder pulling share up the list. In contrast, Meltdown (3.5g) fell -31.8% to rank 3 even as its Vapor Pens namesake, Meltdown Live Resin iKrusher Disposable (1g), sat at rank 8, and Ojos Rojos Live Resin Ikrusher Disposable (1g) held rank 1, signaling divergent momentum between Flower and Vapor Pens around the same flavor set. Four of the top ten are Flower SKUs and four are Vapor Pens, with OG Kush Story Full Spectrum iKrusher Disposable (1g) at rank 2 against OG Kush Story (14.15g) at rank 5, pointing to parallel brand equity that converts across form factors. The pattern implies Josh D is tilting toward a barbell product mix where fast-rising value Flower sizes and established premium disposables anchor demand, favoring pack-size experimentation and cross-form launches over single-SKU dependency.
Top Selling Cannabis Brands
Data for this report comes from real-time sales reporting by participating cannabis retailers via their point-of-sale systems, which are linked up with Headset’s business intelligence software. Headset’s data is very reliable, as it comes digitally direct from our partner retailers. However, the potential does exist for misreporting in the instance of duplicates, incorrectly classified products, inaccurate entry of products into point-of-sale systems, or even simple human error at the point of purchase. Thus, there is a slight margin of error to consider. Brands listed on this page are ranked in the top twenty within the market and product category by total retail sales volume.

