.svg)

Sep-2026
Sales
Trend
6-Month
Product Count
SKUs
Avg Price
YoY Sales Change
YoY Price Change


Where to Buy
Karma (NV) is stocked at 39 licensed dispensaries across Nevada, with the deepest coverage in Las Vegas, Reno, Ely, Henderson, and Fallon. Search by ZIP code or city below to find the closest one, or filter by product type if you are after a specific format.
Market Insights Snapshot
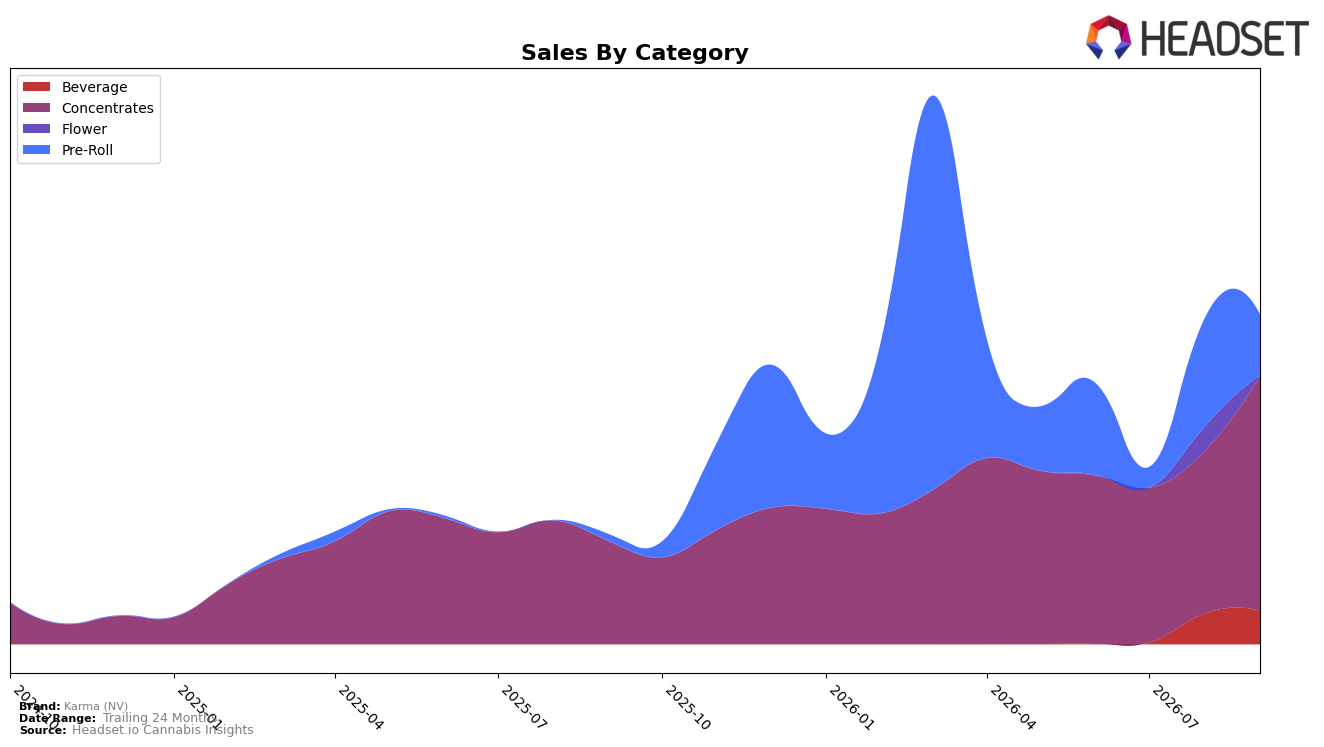
In September 2026, Karma (NV) concentrated 71.30% of sales in Concentrates with a month-over-month gain of 44.52% and a year-over-year increase of 128.36%, while Pre-Roll held 18.43% share but fell 43.96% MoM despite an 845.17% YoY surge. Beverage reached a 10.16% share with a 9.90% MoM lift and no year-over-year baseline, and Flower collapsed to 0.11% share with a 98.47% MoM decline. Average price rose 18.67% YoY to $15.38 while category-level averages diverged (Concentrates at $15.76 and Pre-Roll at $22.35), indicating mix and price both contributed to the 201.45% brand sales YoY and a 1,348.40% two-year expansion. The pattern implies the brand’s volume engine is Concentrates in NV, with Pre-Roll volatility and a stabilizing Beverage foothold acting as secondary levers rather than primary drivers.
Karma (NV) sits at rank 8 in Concentrates in Nevada, and the 44.52% MoM growth alongside 71.30% mix concentration suggests a defensible core where incremental share gains can shift rank quickly, whereas the 43.96% MoM contraction in Pre-Roll and the 98.47% Flower drop argue against overextending into low-consistency segments. The 9.90% MoM uptick in Beverage and 10.16% mix imply a low-price entry lane that can buffer Pre-Roll swings while the 18.67% YoY average price increase supports margin without suppressing demand, given 201.45% YoY sales growth. The implication is a position anchored in Concentrates with selective expansion in Beverage for balance, prioritizing depth in the category where the brand already carries rank 8 over breadth in categories exhibiting whiplash.
Competitive Landscape
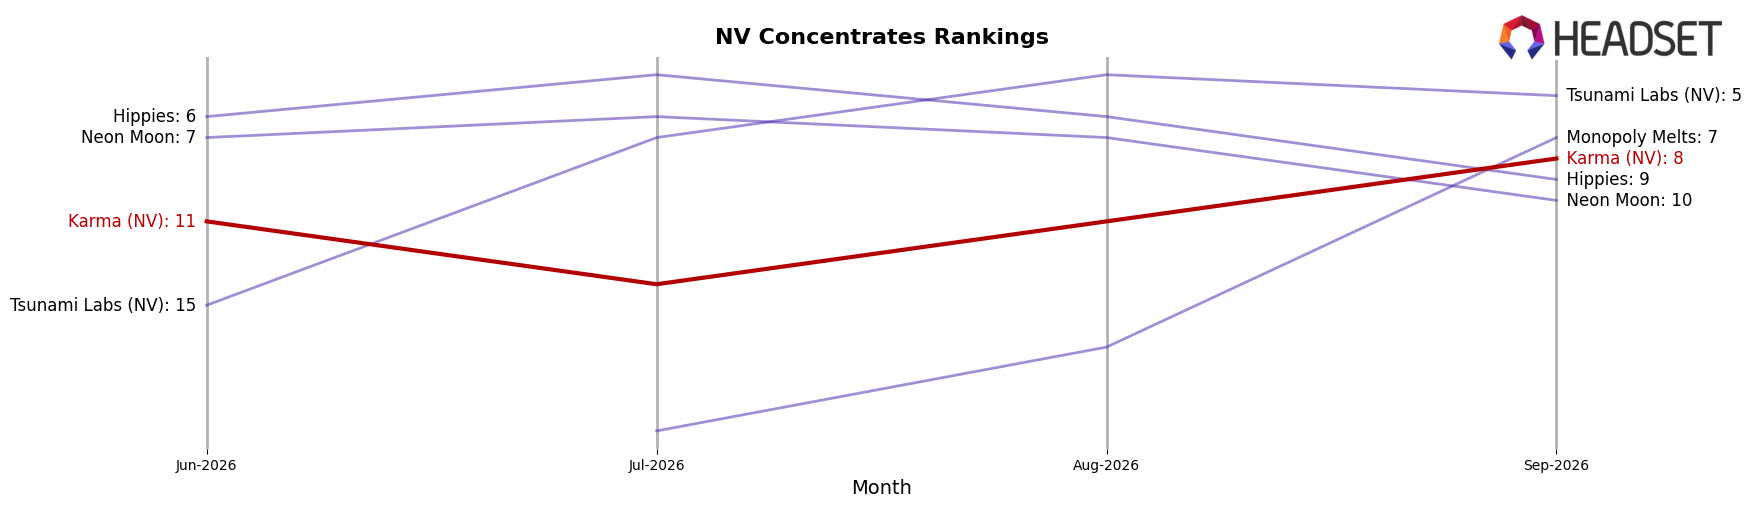
Karma (NV) is ranked #8 in NV Concentrates in September 2026, improving 11 positions from #19 year over year, and rising 3 spots from #11 three months ago; this coincides with peers like Medizin holding #1 despite a 34.8% year-over-year sales decline and City Trees advancing from #6 to #3 on 16.7% sales growth. The rank gain to a peak of #8 in September 2026 places Karma (NV) ahead of the mid-pack while still trailing Tsunami Labs (NV) at #5 after its climb from #10, indicating that Karma (NV)’s upward trajectory is tied more to consistent share capture across months than to category-wide contraction alone, and implies runway to challenge the #5–#7 tier if the momentum from an 11-rank YoY climb sustains.
Notable Products
Recover - CBD/THC 1:1 Hybrid RSO Syringe (1g) posted the largest month-over-month gain at 83.2% while climbing into rank 5, and Rest - Indica RSO Syringe (1g) advanced 69.1% to hold rank 1, indicating RSO formats are accelerating at both the top and mid-tier. Energy - Sativa RSO Syringe (1g) rose 29.4% at rank 2 as Citrus Batter Badder (0.5g) jumped 79.7% at rank 3, and with three of the top five in Concentrates, the portfolio is consolidating around syringe-led concentrates rather than beverages or pre-rolls.
Within Beverages, Red Raspberry Peach Shot (100mg THC, 2oz, 60ml) improved 22.9% at rank 6 while CBD/CBN/THC 1:1:4 Blueberry Lemonade Shot (25mg CBN, 25mg CBD, 100mg THC, 1oz, 30ml) slipped 7.1% at rank 7, and the category accounts for three of the top ten but lacks a breakout mover; the top beverage SKU’s $2,806 sales trail the leading concentrate by a wide gap. The pattern implies Karma (NV) is being pulled toward high-velocity RSO concentrates, with beverages and emerging pre-rolls playing secondary roles rather than setting the growth curve.
Top Selling Cannabis Brands






Data for this report comes from real-time sales reporting by participating cannabis retailers via their point-of-sale systems, which are linked up with Headset’s business intelligence software. Headset’s data is very reliable, as it comes digitally direct from our partner retailers. However, the potential does exist for misreporting in the instance of duplicates, incorrectly classified products, inaccurate entry of products into point-of-sale systems, or even simple human error at the point of purchase. Thus, there is a slight margin of error to consider. Brands listed on this page are ranked in the top twenty within the market and product category by total retail sales volume.

