Jun-2026
Sales
Trend
6-Month
Product Count
SKUs
Avg Price
YoY Sales Change
YoY Price Change
Market Insights Snapshot
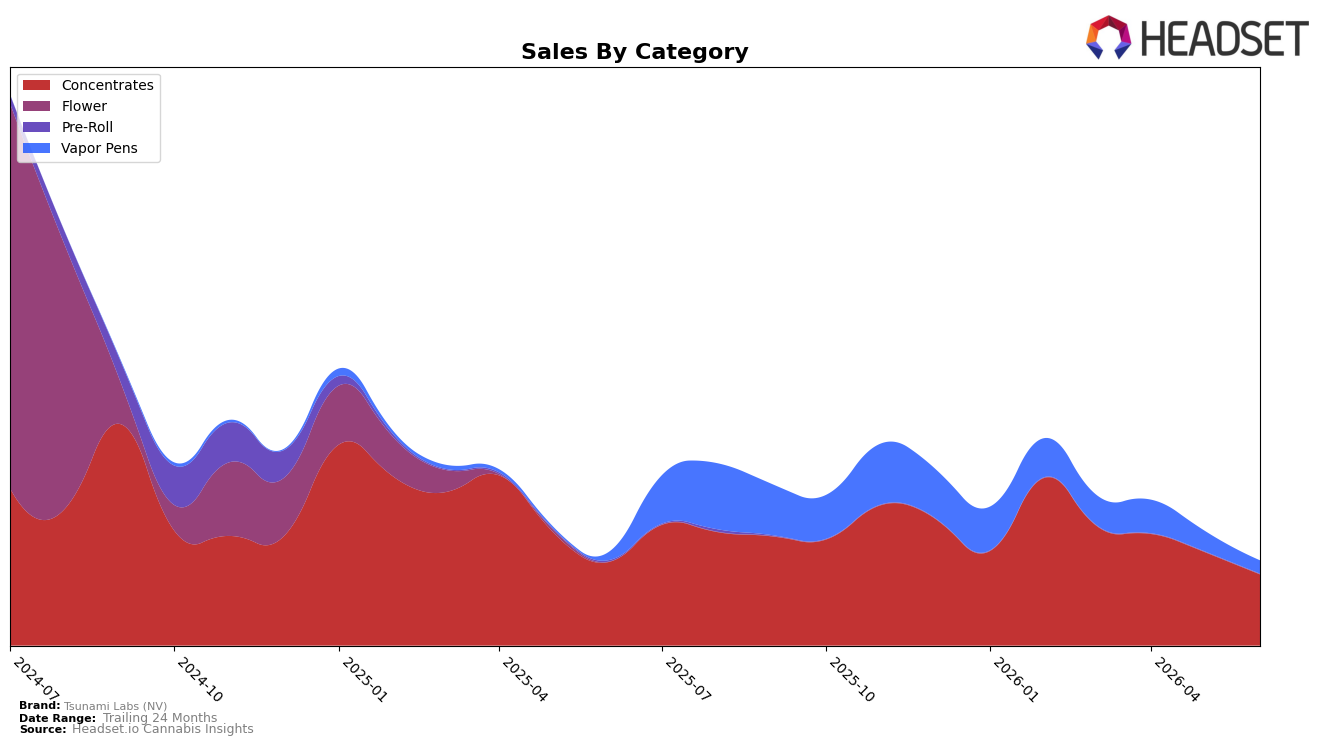
Tsunami Labs (NV) leaned heavily into Concentrates in June 2026, with the category holding 84.53% share while Vapor Pens contributed 15.47%; within the month, Concentrates fell 23.95% MoM and Vapor Pens declined 35.92% MoM, and year over year Concentrates contracted 14.77% while Vapor Pens expanded 70.69%. Despite the portfolio tilt, overall brand sales were down 8.75% YoY alongside a 6.80% YoY drop in average price to $20.14, and the brand sat at rank 15 in Concentrates in Nevada; the pattern implies a dependency on a shrinking core category while a smaller, faster-growing segment has not yet offset volume losses.
The shift—Vapor Pens up 70.69% YoY but still just 15.47% of mix versus Concentrates at 84.53%—signals an early-stage diversification that is not counteracting a 14.77% YoY decline in the anchor category and a 23.95% MoM drop that steepens short-term headwinds. With average price down 6.80% YoY and a 35.92% MoM contraction in Vapor Pens, the brand’s current positioning in Nevada Concentrates at rank 15 suggests mid-pack visibility; the implication is that maintaining share will require either expanding the higher-growth Vapor Pens contribution beyond 15.47% or stabilizing Concentrates velocity to avoid further mix-driven drag.
Competitive Landscape
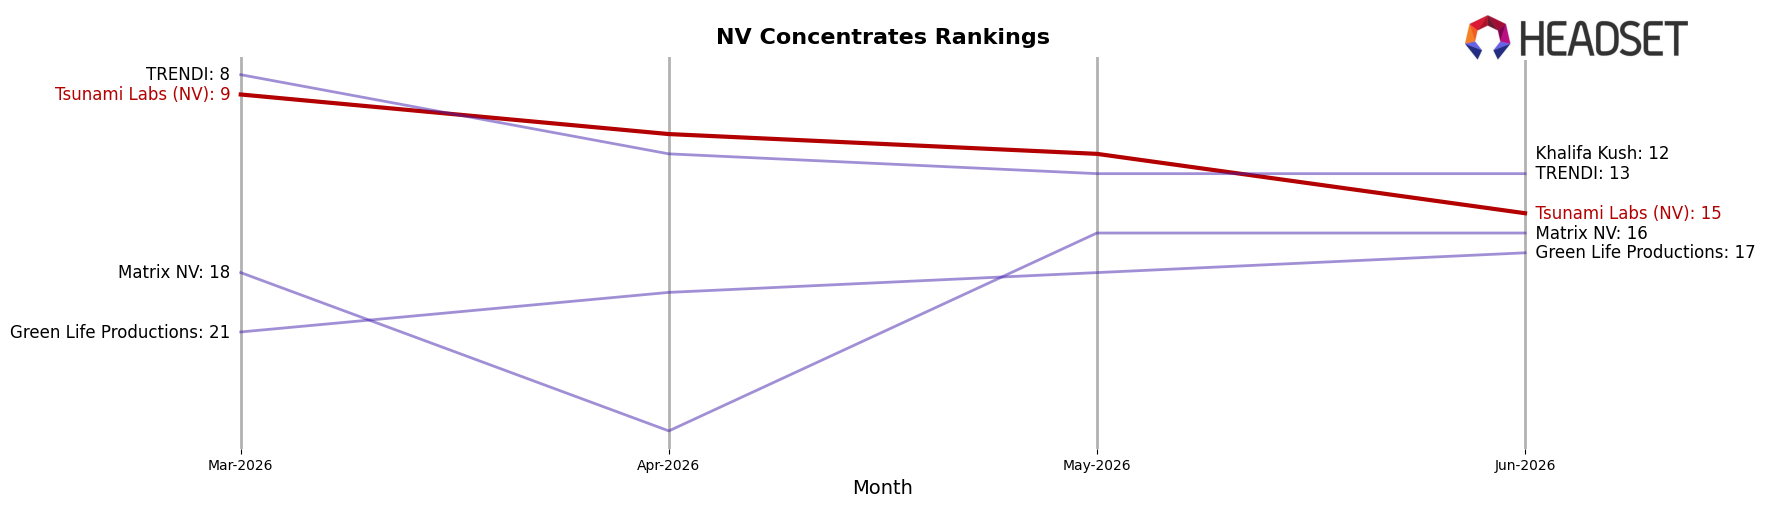
Tsunami Labs (NV) sits at rank #15 in NV Concentrates in June 2026, sliding 3 positions year over year from #12 and falling 6 spots since March 2026 when it held #9; the brand also retreated 11 ranks from its February 2026 peak at #4, indicating a reversal from earlier momentum despite only one month-on-month rank change of -? being unreported here and a single dollar-based datapoint not required for inference. In contrast, Medizin held #1 with no YoY rank change (staying at #1) even as its sales fell 37%, and Nature's Chemistry climbed from #13 to #4 alongside a 102% sales increase, while City Trees remained at #3 with a 41% sales decline; this combination of Tsunami Labs (NV) dropping 6 ranks since March 2026 and the market leader stability alongside upward mobility at #4 implies that Tsunami Labs (NV) is losing relative share to both stable incumbents and fast risers, pointing to a need to counter competitive gains rather than seasonal volatility.
Notable Products
Dante's Hawk Live Resin Badder (1g) posted the steepest decline in June 2026 at -44.4%, sliding to rank 7 while Garlic Kush Cake Live Resin Badder (1g) fell -34.9% at rank 10, signaling volatility within core Concentrates. Offsetting this, Smoke Mountain Cured Resin Cartridge (1g) jumped +71.7% to rank 4, while Government Oasis Live Resin Diamonds HTE Cartridge (0.5g) contracted -11.3% at rank 6, indicating a mixed but accelerating shift toward Vapor Pens. With seven of the top ten being Concentrates yet the only >50% move coming from a Vapor Pen and two major Concentrates declines over -30%, the pattern implies Tsunami Labs (NV) is leaning into cartridges to stabilize revenue concentration despite a legacy Concentrates skew.
Top Selling Cannabis Brands
Data for this report comes from real-time sales reporting by participating cannabis retailers via their point-of-sale systems, which are linked up with Headset’s business intelligence software. Headset’s data is very reliable, as it comes digitally direct from our partner retailers. However, the potential does exist for misreporting in the instance of duplicates, incorrectly classified products, inaccurate entry of products into point-of-sale systems, or even simple human error at the point of purchase. Thus, there is a slight margin of error to consider. Brands listed on this page are ranked in the top twenty within the market and product category by total retail sales volume.

