.svg)


Where to Buy
Khush Kush is stocked at 48 licensed dispensaries across Washington, with the deepest coverage in Everett, Tacoma, Spokane, Bellevue, and Arlington. Search by ZIP code or city below to find the closest one, or filter by product type if you are after a specific format.
Market Insights Snapshot
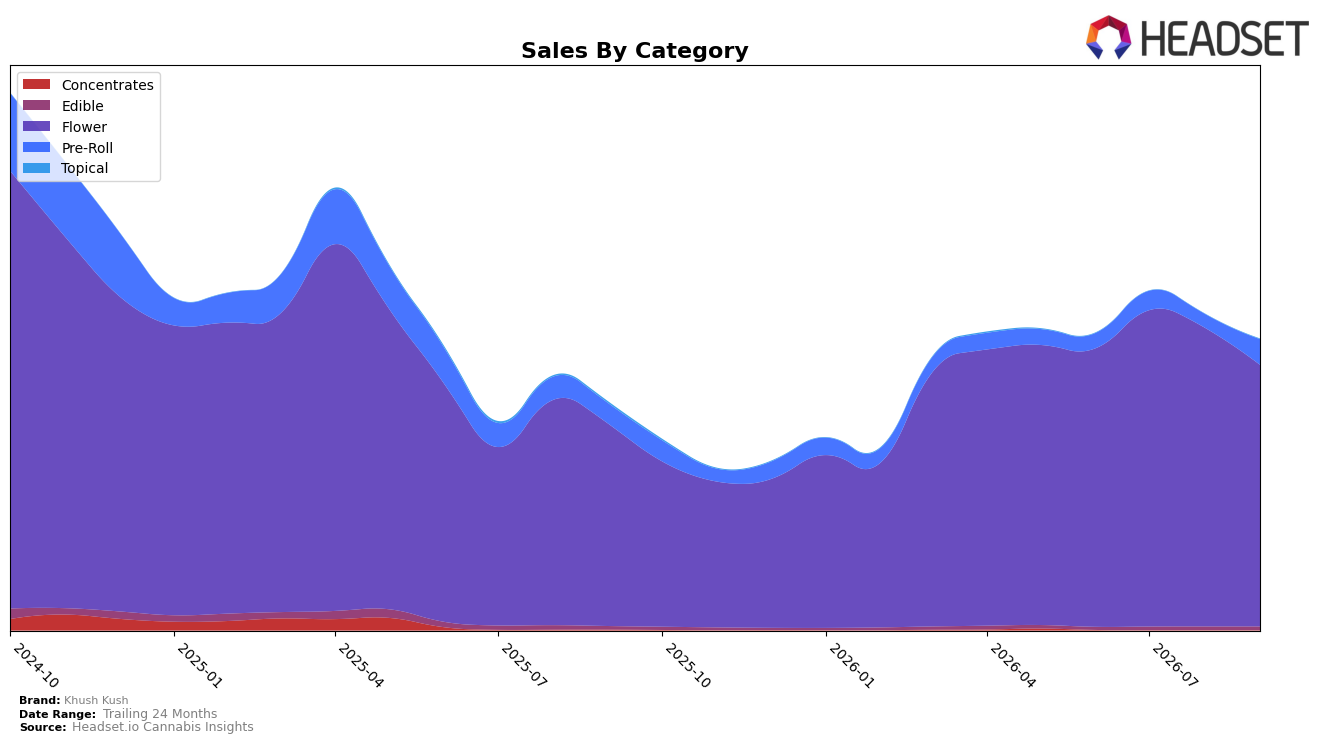
Khush Kush concentrated 90.03% of September 2026 sales in Flower, where sales were up 29.34% year over year but down 12.48% month over month, while Pre-Roll held 8.74% share with 25.93% YoY growth and an 88.00% MoM surge. Edible accounted for 1.15% share with 3.98% YoY and 0.19% MoM growth, and Topical slipped to 0.08% share with an 82.67% YoY decline and no reported month-over-month figure; within Flower, Khush Kush sat at rank 60 in Washington. The mix shift implies a reliance on Flower that lifted annual totals but introduced monthly volatility, while the sharp MoM acceleration in Pre-Roll and the negligible Edible change suggest incremental diversification that could buffer rank-60 exposure in Washington.
With brand sales up 27.71% year over year but down 39.32% over 24 months and average price up 40.84%, the pattern indicates pricing rather than breadth is doing more of the work, as a 12.48% MoM drop in the 90.03% Flower base can outweigh an 88.00% MoM gain in the 8.74% Pre-Roll base. Given a Flower average price of $31.49 alongside a $20.82 overall average price, the gap points to lower-priced non-Flower units scaling share without yet shifting overall revenue concentration, which implies Khush Kush’s positioning remains Flower-led with early-stage support from Pre-Roll that reduces near-term downside risk but does not materially change rank 60 competitive exposure.
Competitive Landscape
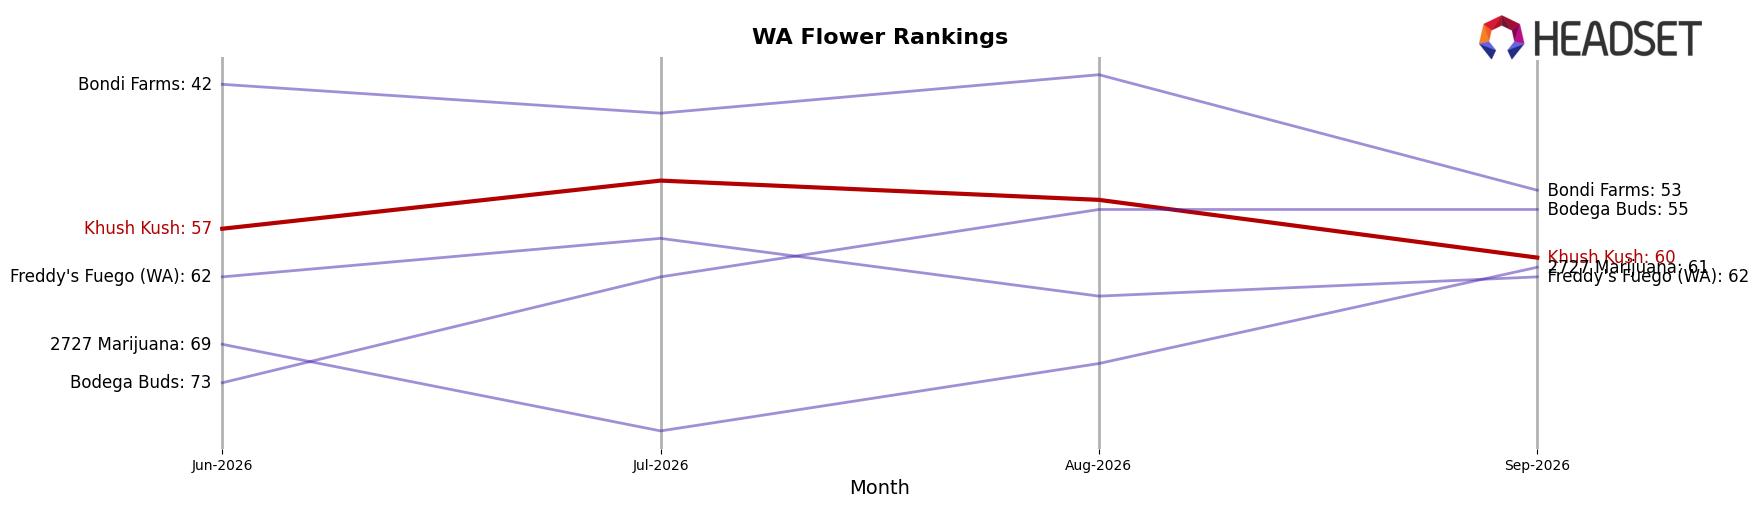
Khush Kush sits at rank #60 in WA Flower for September 2026, a 18-place improvement from #78 year over year, but a 3-position slip from #57 in June 2026 indicates recent softening after mid-year gains. Against top rivals, Phat Panda held #1 both year over year and in September 2026 while growing sales 19%, and Hemp Kings jumped from #24 to #5 with 105% YoY sales growth, outpacing Khush Kush’s rank recovery and compressing share opportunities near the top; meanwhile, Legends stayed at #2 despite a 17% YoY sales decline, signaling that rank mobility is achievable when incumbents contract. With a historical peak at #44 in April 2025 and the current #60 alongside a 18-rank YoY climb and a 3-month slide of 3 ranks, the trajectory implies Khush Kush is regaining ground but must convert momentum into sustained quarter-over-quarter advances to re-approach the mid-40s band.
Notable Products
Mochilato Pre-Roll 2-Pack (1g) posted the largest movement in September 2026 with a 60.95% month-over-month gain, while Sticky Gorilla #4 (3.5g) fell 39.96% and slid to rank 4. Brandywine Pre-Roll 2-Pack (1g) also surged 52.95% into rank 5, whereas Sticky Gorilla #4 (7g) declined 22.61% at rank 9. With six of the top ten coming from the Pre-Roll category and Sticky Gorilla #4 Pre-Roll 2-Pack (1g) holding rank 1 despite a 1.22% dip, the mix signals a pivot toward smaller-format inhalables as Flower sizes retreat even with Brandywine (3.5g) rising 25.48%.
Top Selling Cannabis Brands






Data for this report comes from real-time sales reporting by participating cannabis retailers via their point-of-sale systems, which are linked up with Headset’s business intelligence software. Headset’s data is very reliable, as it comes digitally direct from our partner retailers. However, the potential does exist for misreporting in the instance of duplicates, incorrectly classified products, inaccurate entry of products into point-of-sale systems, or even simple human error at the point of purchase. Thus, there is a slight margin of error to consider. Brands listed on this page are ranked in the top twenty within the market and product category by total retail sales volume.

