.svg)


Market Insights Snapshot
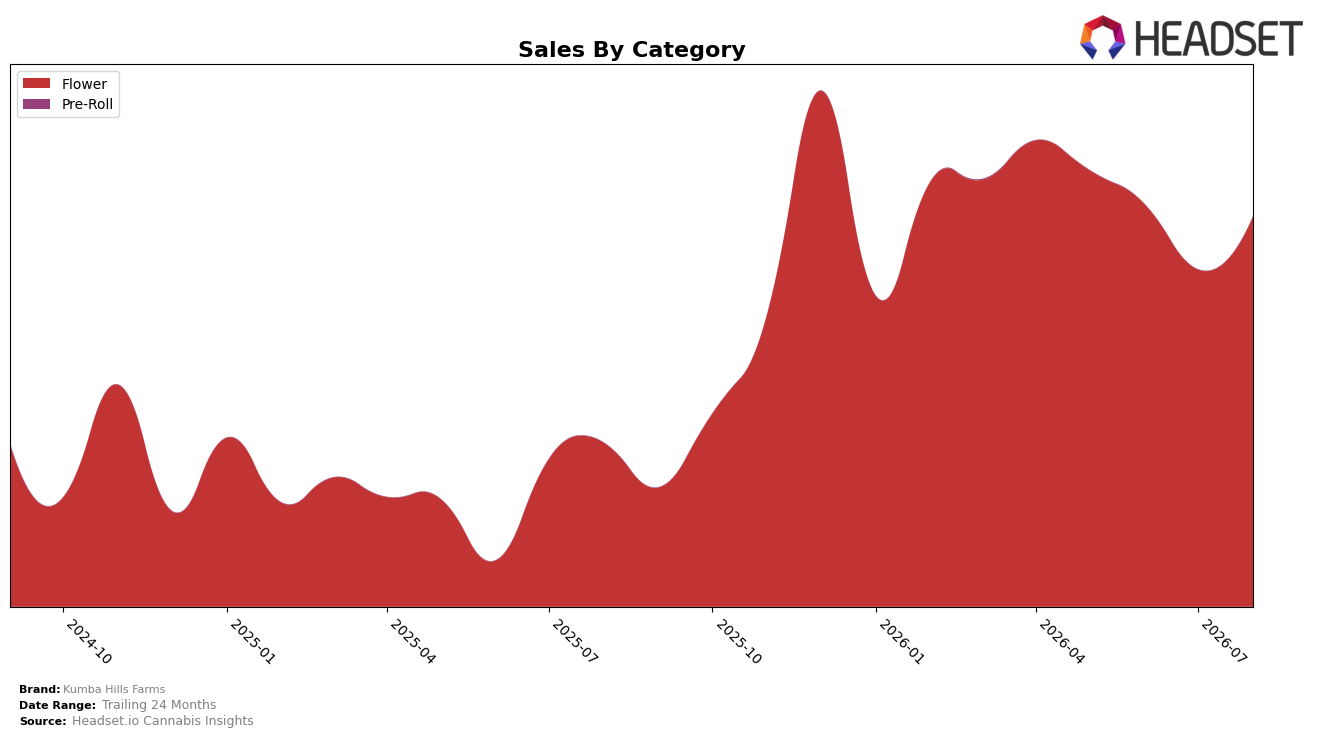
In August 2026, Kumba Hills Farms concentrated 100.0% of sales in Flower, with year-over-year sales up 138.6% and month-over-month up 15.8%, while average price rose 26.2% YoY to $15.36. Within the Oregon Flower context, the brand held rank 31 and expanded share entirely within a single category mix, indicating a deliberate deepening rather than diversification; the pattern implies the brand is trading up on price while still capturing volume, a combination that typically pushes a Flower-focused player toward mid-tier visibility despite a rank at 31.
The single-category reliance, paired with a 138.6% YoY lift and a 15.8% MoM gain, suggests pricing power that is not eroding demand, and a 26.2% YoY price increase signals movement toward premium positioning within Flower. Holding rank 31 in Oregon Flower while sustaining 100.0% category concentration implies room to climb if mix remains tight and pricing discipline continues; the thesis is that Kumba Hills Farms is accruing differentiation through price-led Flower focus rather than breadth, which should convert into incremental rank gains if the MoM momentum persists.
Competitive Landscape
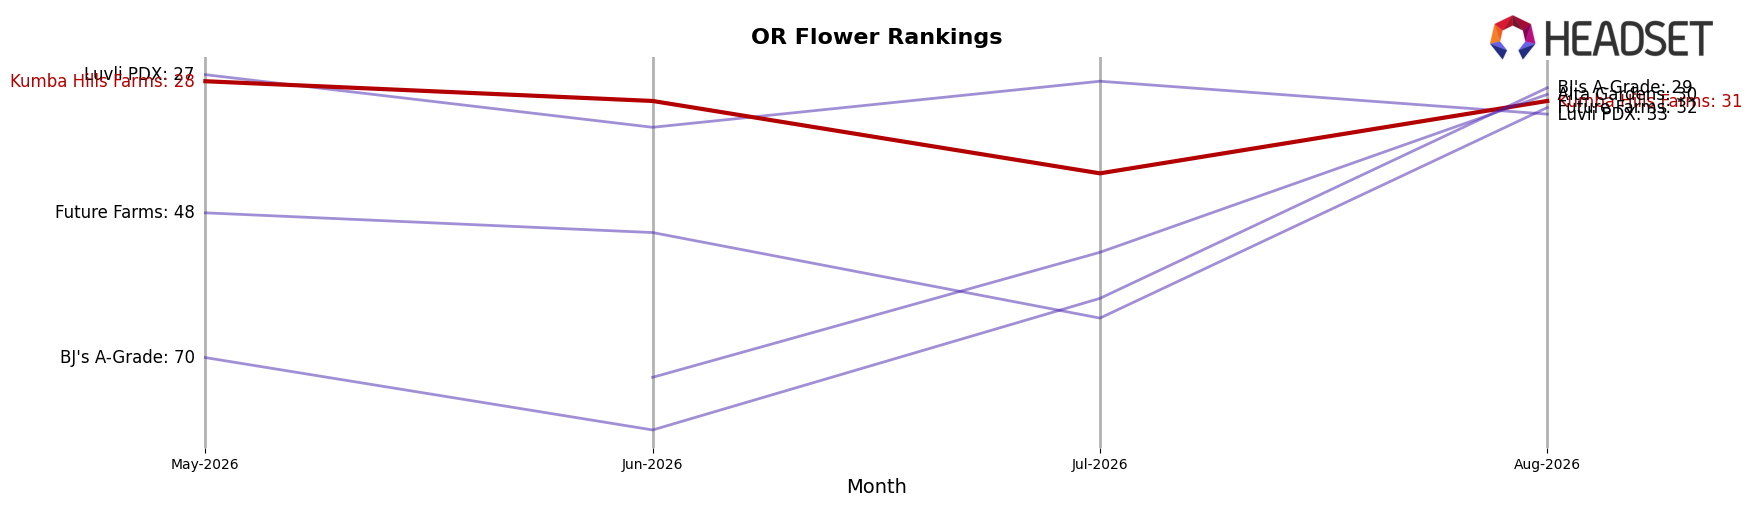
Kumba Hills Farms sits at rank #31 in August 2026, improving 54 positions year over year from #85, but slipping 3 spots from #28 in May 2026 and still trailing its peak rank of #22 from December 2025; meanwhile, Grown Rogue moved up from #3 to #1 with a 49% YoY sales increase and Panda Farms surged from #99 to #4 alongside a 1,060% YoY sales increase, indicating that Kumba Hills Farms’ large YoY rank gain is outpaced by faster-climbing leaders and the recent 3-position slide suggests momentum has cooled relative to top-tier competitors.
Notable Products
Kush Mintz (3.5g) posted the steepest movement with a -34.9% month-over-month drop while holding a shared rank position at 2, indicating demand pressure even near the top slot and a likely price or inventory disconnect. Gary Payton (3.5g) sat at rank 1 as the sole leader while two SKUs tie at rank 2 and two more tie at rank 4, creating a compressed top-five ladder where small swings can reorder positions by 1–2 ranks in September 2026. With all top-10 entries in Flower and four SKUs clustered between ranks 2–5, portfolio risk is concentrated in a single category and a narrow mid-rank band, implying Kumba Hills Farms should diversify formats or stagger drops to avoid volatility from a few overlapping Flower strains.
Top Selling Cannabis Brands






Data for this report comes from real-time sales reporting by participating cannabis retailers via their point-of-sale systems, which are linked up with Headset’s business intelligence software. Headset’s data is very reliable, as it comes digitally direct from our partner retailers. However, the potential does exist for misreporting in the instance of duplicates, incorrectly classified products, inaccurate entry of products into point-of-sale systems, or even simple human error at the point of purchase. Thus, there is a slight margin of error to consider. Brands listed on this page are ranked in the top twenty within the market and product category by total retail sales volume.

