Jun-2026
Sales
Trend
6-Month
Product Count
SKUs
Avg Price
YoY Sales Change
YoY Price Change
Market Insights Snapshot
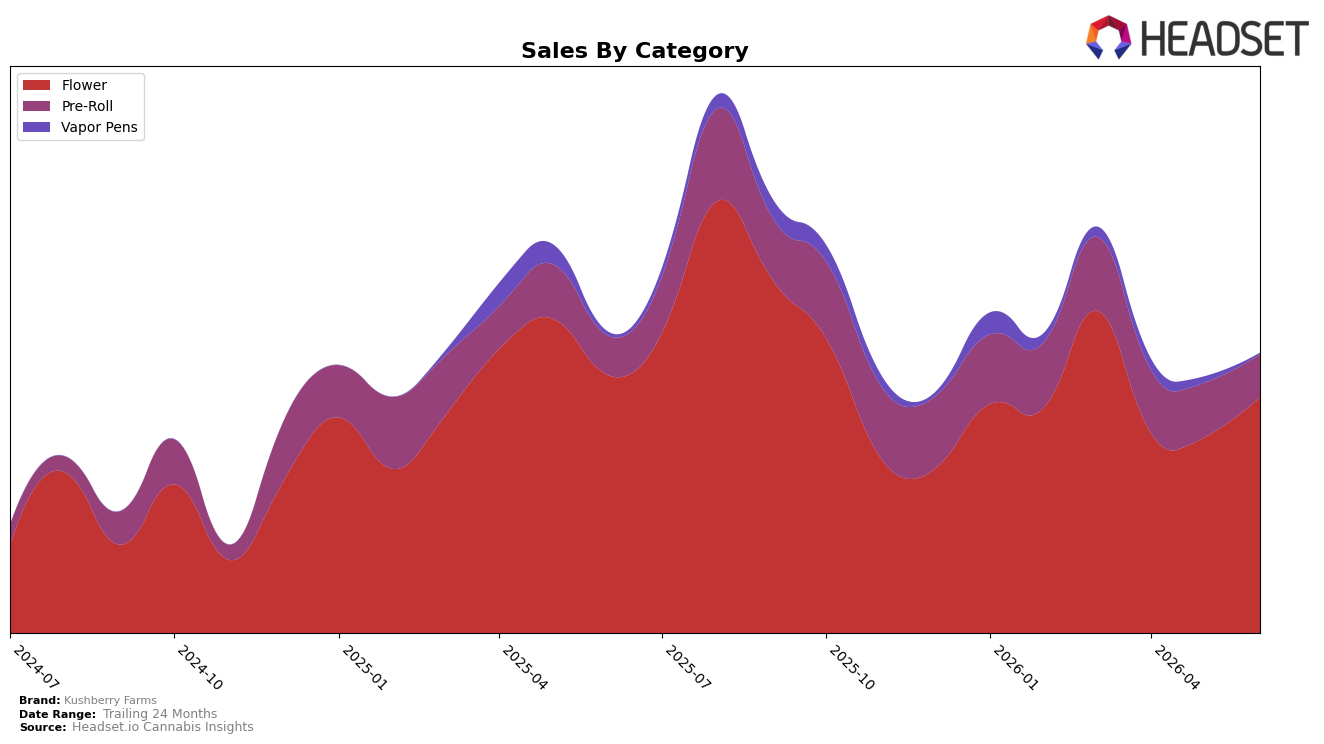
In June 2026, Kushberry Farms concentrated 84.27% of sales in Flower, where year-over-year sales fell 8.59% while month-over-month sales rose 20.49%, and the brand held rank 13 in Flower. Pre-Roll contributed 15.28% share with an 8.58% year-over-year increase but a 21.34% month-over-month decline, while Vapor Pens slipped to 0.46% share with a 63.85% year-over-year drop and a 79.36% month-over-month drop; the average price across the brand rose 6.50% year-over-year even as total brand sales were down 6.99% year-over-year. The pattern implies a pivot back toward Flower volume recovery on a monthly basis while trimming breadth in Vapor Pens, with the Flower-heavy mix cushioning the month’s performance but limiting diversification.
The tilt toward Flower, combined with a 20.49% month-over-month gain and a 13th-place rank in Nevada Flower, implies a positioning anchored in core Flower velocity rather than expansion categories. With Pre-Roll showing a 21.34% month-over-month contraction despite an 8.58% year-over-year lift, and Vapor Pens shrinking 79.36% month-over-month alongside a 63.85% year-over-year decline, the mix suggests pricing power concentrated in Flower (amid a 6.50% brand-wide price increase) but a retreat from ancillary formats, implying near-term share stability in core while ceding optionality in emerging segments.
Competitive Landscape
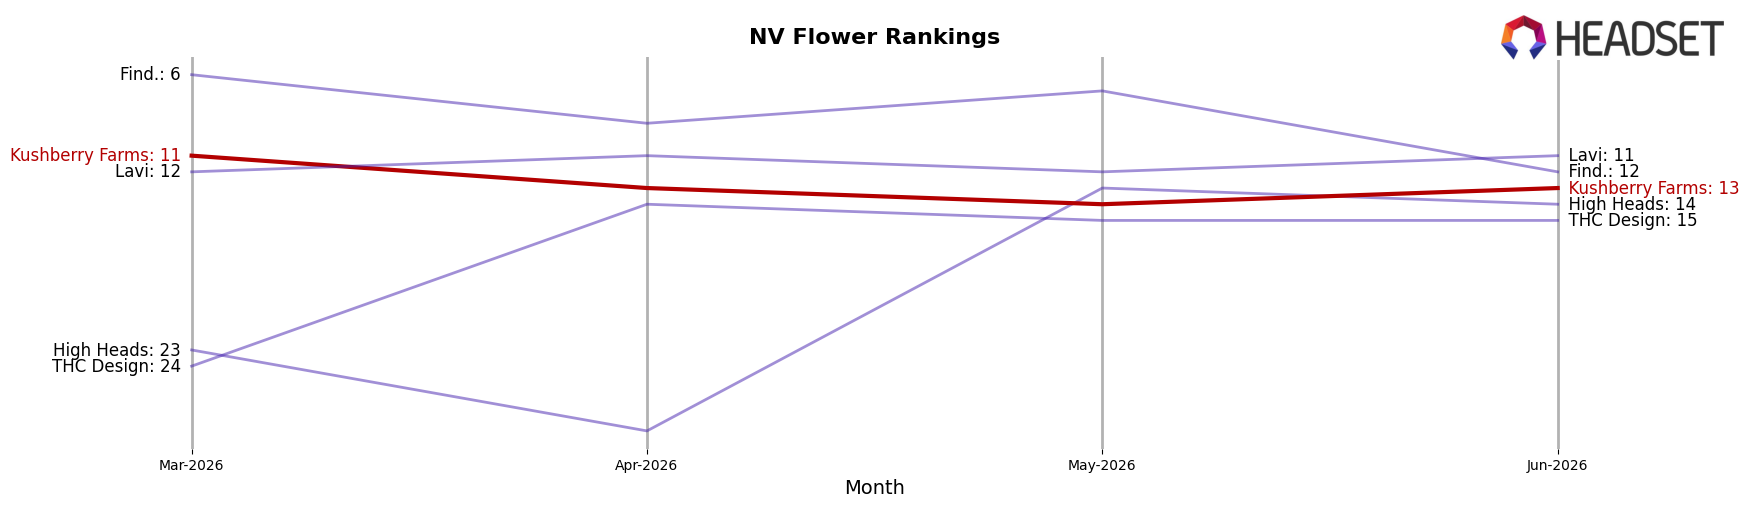
Kushberry Farms is ranked #13 in NV Flower in June 2026, down 3 positions year over year from #10, and also slid 2 spots since March 2026 when it was #11; against that backdrop, STIIIZY held #1 year over year and in June 2026 while FloraVega / Welleaf jumped from #22 to #3 with a 260.35% YoY sales increase, indicating share is consolidating toward faster risers as incumbents like RYTHM fell from #2 to #4 YoY with a -6.87% sales change; given a peak of #6 in September 2025 and a current placement outside the top 10, the trajectory implies Kushberry Farms must reverse a two-quarter drift or cede durable rank to entrants expanding 3–20 ranks faster.
Notable Products
Kush Mints Pre-Roll (1g) posted the standout move in June 2026 with a +64.6% MoM surge and reached rank 4, while True Mints Pre-Roll (1g) rose +48.7% to rank 2, indicating momentum concentrated in Pre-Rolls. In contrast, Dutch Hawaiian Pre-Roll (1g) fell -24.6% to rank 3 and Sticky Buns (3.5g) slipped -11.1% at rank 6, even as Dutch Hawaiian (3.5g) held rank 1 with +32.8% MoM and the Dutch Hawaiian (14g) format sat at rank 8 with $58,171. Four of the top ten are Flower SKUs, but two of the top four are Pre-Rolls, pointing to a shift in demand toward convenient formats even as flagship Flower keeps visibility at the very top. Together, the mix implies Kushberry Farms is tilting its commercial emphasis toward scaled Pre-Roll velocity while defending premium Flower leadership.
Top Selling Cannabis Brands
Data for this report comes from real-time sales reporting by participating cannabis retailers via their point-of-sale systems, which are linked up with Headset’s business intelligence software. Headset’s data is very reliable, as it comes digitally direct from our partner retailers. However, the potential does exist for misreporting in the instance of duplicates, incorrectly classified products, inaccurate entry of products into point-of-sale systems, or even simple human error at the point of purchase. Thus, there is a slight margin of error to consider. Brands listed on this page are ranked in the top twenty within the market and product category by total retail sales volume.

