Jun-2026
Sales
Trend
6-Month
Product Count
SKUs
Avg Price
YoY Sales Change
YoY Price Change
Market Insights Snapshot
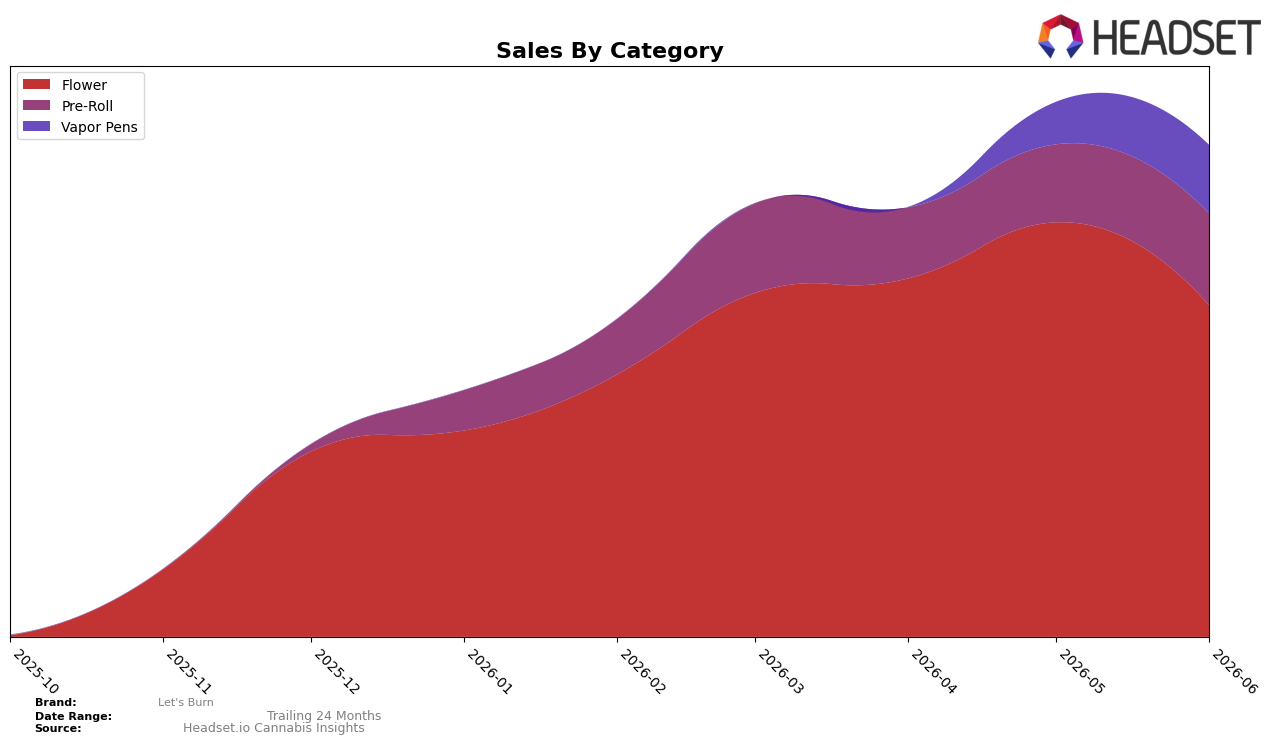
In June 2026, Let's Burn concentrated 67.44% of sales in Flower, where month-over-month sales declined 20.11%, while Pre-Roll rose 17.89% to 18.66% share and Vapor Pens jumped 61.42% to 13.91% share. The brand held rank 2 in Flower in Connecticut, indicating category leadership even as mix tilts: average prices spanned $32.46 in Flower versus $8.96 in Pre-Roll, and $57.01 in Vapor Pens, implying an upward mix effect toward higher-ticket formats despite a Flower pullback. The pattern implies a near-term pivot from a single-category anchor toward a three-pillar portfolio, with growth vectors in Pre-Roll and Vapor Pens offsetting Flower softness and preserving competitive footing at rank 2.
The shift toward Vapor Pens and Pre-Roll—collectively 32.57% share with month-over-month gains of 61.42% and 17.89%, respectively—suggests demand elasticity at lower unit price points (Pre-Roll) and premium tolerance in higher-priced cartridges (Vapor Pens at $57.01). Maintaining rank 2 in Flower while shrinking 20.11% month over month, alongside mix gains of 2–4 percentage points across non-Flower formats, implies repositioning headroom: leaning into Vapor Pens can lift revenue yield per unit, while Pre-Roll expansion can stabilize volume. The implication is a barbell strategy where Flower sustains visibility at rank 2 in Connecticut while incremental investment in Vapor Pens and Pre-Roll captures divergent price segments without eroding the Flower core.
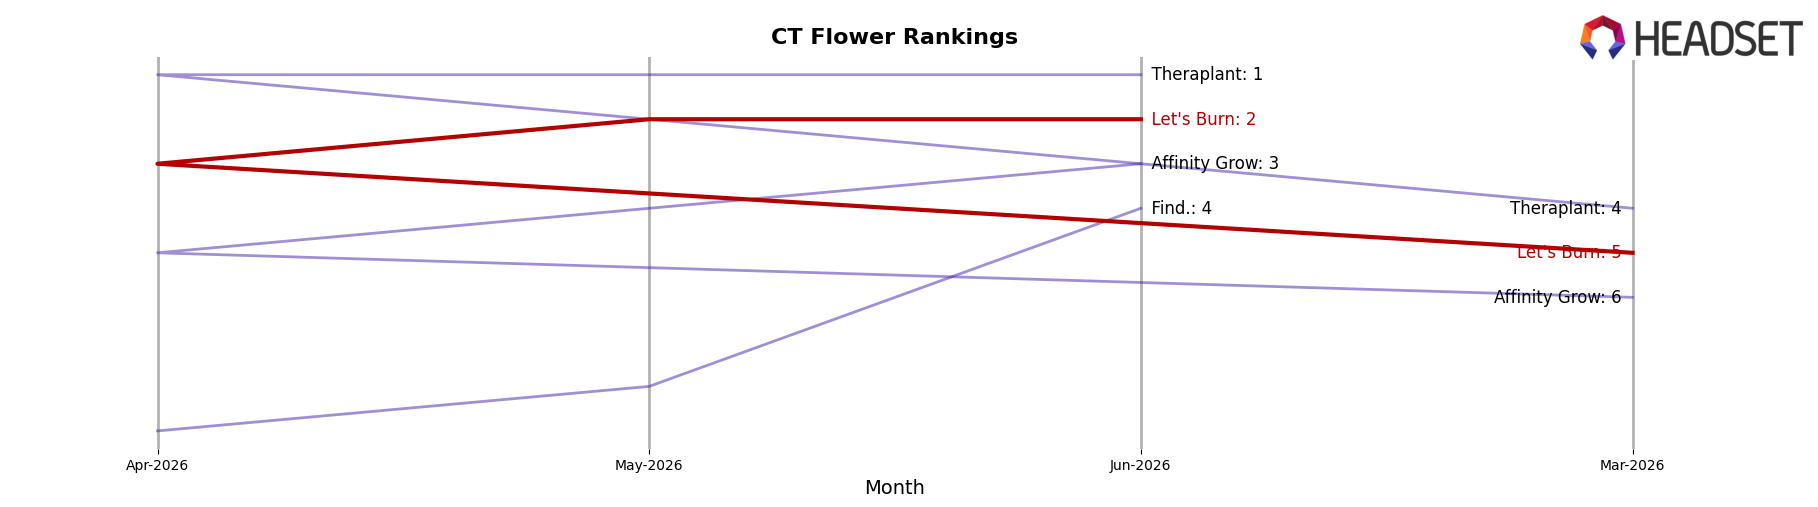
Competitive Landscape
Let's Burn sits at rank #2 in CT Flower in June 2026, up 3 positions from #5 in March 2026, while year-over-year rank is unavailable and the brand also reached a new peak rank of #2 in June 2026; meanwhile, Theraplant holds #1 after improving 4 positions year over year with a 69.2% YoY sales increase, and Affinity Grow is at #3 despite a 2.3% YoY sales decline and a rank of #4 a year ago, indicating Let's Burn’s climb into the top two over three months outpaced mid-pack rivals but still trails a leader expanding share.
Notable Products
Mule Fuel (3.5g) posted the steepest decline at -63.3% MoM and slid to rank 9 in June 2026, while Blue Dream Pre-Roll (1g) surged +77.4% MoM to rank 1, implying a sharp pivot in shopper preference toward value-ready formats. CT Kush Cake (3.5g) dropped -37.0% MoM despite holding a high dollar base of $103,791 and sat at rank 3, whereas CT Rainbows (3.5g) climbed +70.1% MoM to rank 6, indicating volatility within Flower that contrasts with Pre-Roll momentum. With four of the top ten as Pre-Roll SKUs and two sitting in the top three ranks, the mix skews toward quick-consumption formats over bulk Flower. The pattern implies Let's Burn is consolidating demand around flagship Pre-Rolls while rationalizing underperforming Flower positions.
Top Selling Cannabis Brands
Data for this report comes from real-time sales reporting by participating cannabis retailers via their point-of-sale systems, which are linked up with Headset’s business intelligence software. Headset’s data is very reliable, as it comes digitally direct from our partner retailers. However, the potential does exist for misreporting in the instance of duplicates, incorrectly classified products, inaccurate entry of products into point-of-sale systems, or even simple human error at the point of purchase. Thus, there is a slight margin of error to consider. Brands listed on this page are ranked in the top twenty within the market and product category by total retail sales volume.

