


Where to Buy
Lifties is stocked at 31 licensed dispensaries across Ohio, with the deepest coverage in Columbus, Akron, Athens, Painesville, and Ashtabula. Search by ZIP code or city below to find the closest one.
Market Insights Snapshot
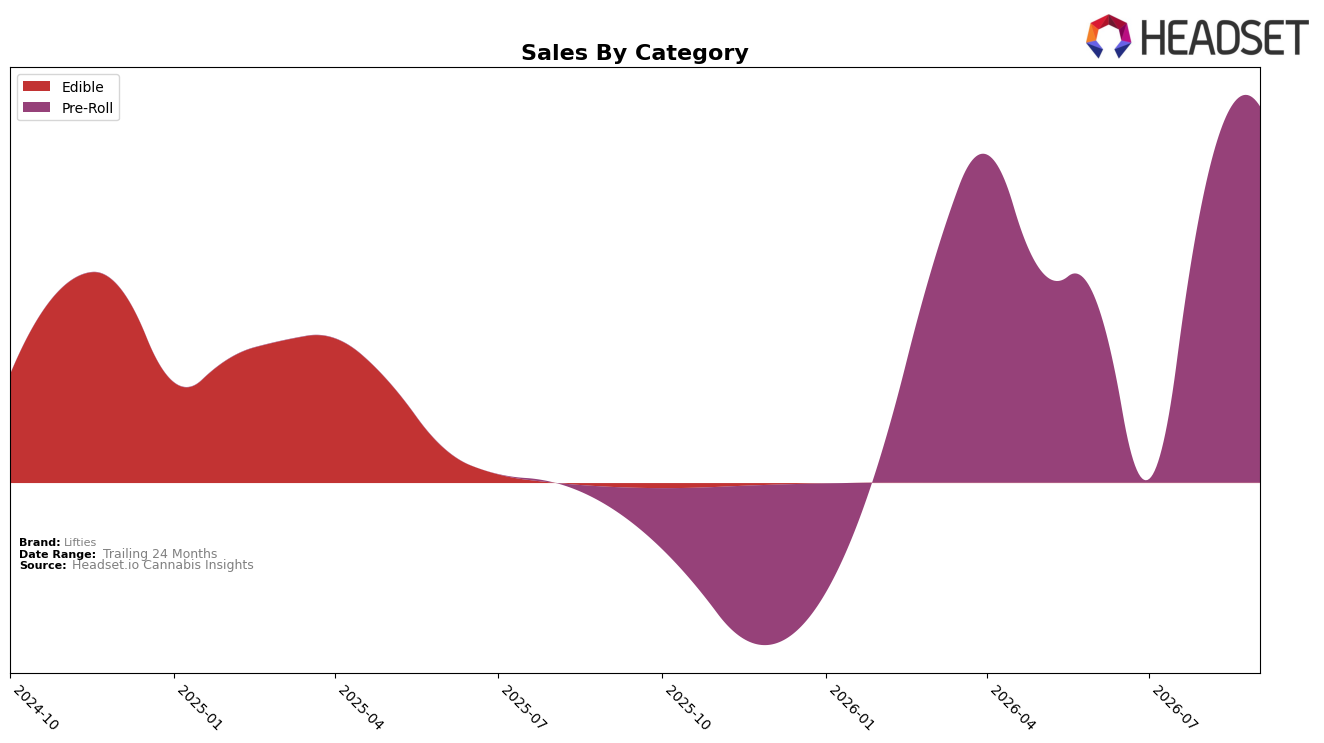
In September 2026, Lifties operated as a single-category brand with Pre-Roll accounting for 100.0% category mix share, paired with a 28.45% month-over-month sales increase and a stable 0 rank change in category breadth given no diversification. Average price held at $15.77 while share concentration at 100.0% implies zero intra-brand category rotation and a 0 percentage-point shift in mix YoY, indicating that September 2026 momentum came from velocity within Pre-Roll rather than mix expansion. The pattern implies Lifties is trading depth for breadth, leaning on a single growth engine rather than distributing risk across categories.
Positionally, a 28.45% MoM lift within a 100.0% Pre-Roll mix, combined with a rank of 24 in Pre-Roll in Ohio, signals that Lifties competes via intensified SKU or store-level throughput rather than portfolio adjacency, with 0 percentage-point mix change leaving limited insulation if segment demand cools. With 237.62% sales growth over 24 months but 0 categories beyond Pre-Roll, the brand’s exposure is concentrated and could cap share gains if rank compression occurs from peers expanding formats; the implication is that Lifties needs either further MoM velocity gains of 10%+ or a second category entry to progress meaningfully from rank 24.
Competitive Landscape
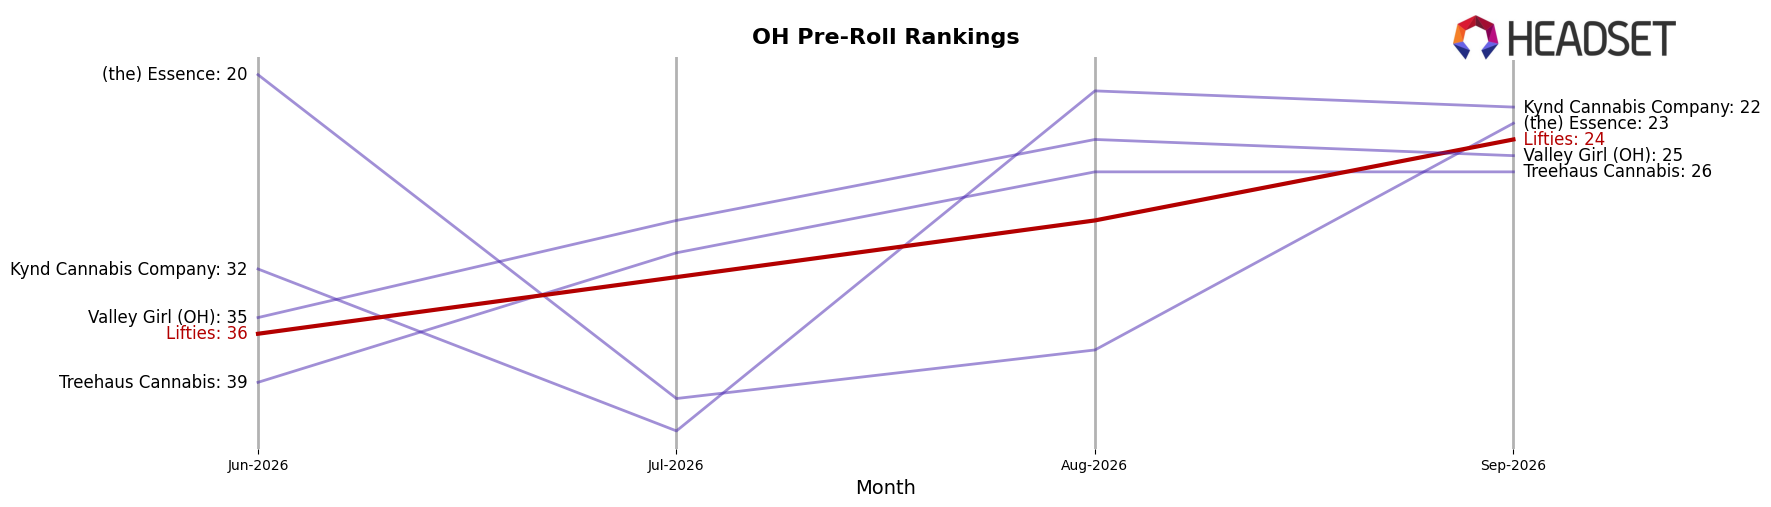
Lifties sits at rank #24 in OH Pre-Roll in September 2026, improving 12 positions from #36 in June 2026, and matching its peak rank of #24 in September 2026, while year-over-year rank is unavailable. Competitors reshuffled more sharply: Pure Ohio Wellness moved up 6 ranks to #3 with a 586.6% YoY sales increase, and Dogwalkers climbed 4 ranks to #4 alongside a 178.8% YoY sales gain, whereas Buckeye Relief advanced 1 rank to #2 with 54.7% YoY growth; this implies Lifties’ recent rank ascent is outpaced by faster-moving rivals at the top, so sustaining momentum likely requires closing the gap in velocity and distribution rather than relying on incremental position gains.
Notable Products
S.B Rosin Kief Infused Pre-Roll (1g) posted the standout move in September 2026 with a +698.5% month-over-month surge and a top-2 rank, while Opening Day Rosin Infused Pre-Roll (1g) also accelerated at +95.1% and reached rank 3. Super Boof Infused Pre-Roll (1g) held rank 1 with a +6.3% MoM lift and remains the only SKU above $73,000, and three of the top four are Pre-Roll SKUs, indicating a concentrated lineup. The pattern implies Lifties is consolidating share around infused Pre-Rolls where extreme MoM gains are converting into upper-tier ranks, signaling resource pull toward high-potency pre-roll formulations.
Top Selling Cannabis Brands



Data for this report comes from real-time sales reporting by participating cannabis retailers via their point-of-sale systems, which are linked up with Headset’s business intelligence software. Headset’s data is very reliable, as it comes digitally direct from our partner retailers. However, the potential does exist for misreporting in the instance of duplicates, incorrectly classified products, inaccurate entry of products into point-of-sale systems, or even simple human error at the point of purchase. Thus, there is a slight margin of error to consider. Brands listed on this page are ranked in the top twenty within the market and product category by total retail sales volume.

