.svg)


Where to Buy
O'Dank is stocked at 50 licensed dispensaries across Ohio, with the deepest coverage in Columbus, Cincinnati, Akron, Athens, and Oxford. Search by ZIP code or city below to find the closest one, or filter by product type if you are after a specific format.
Market Insights Snapshot
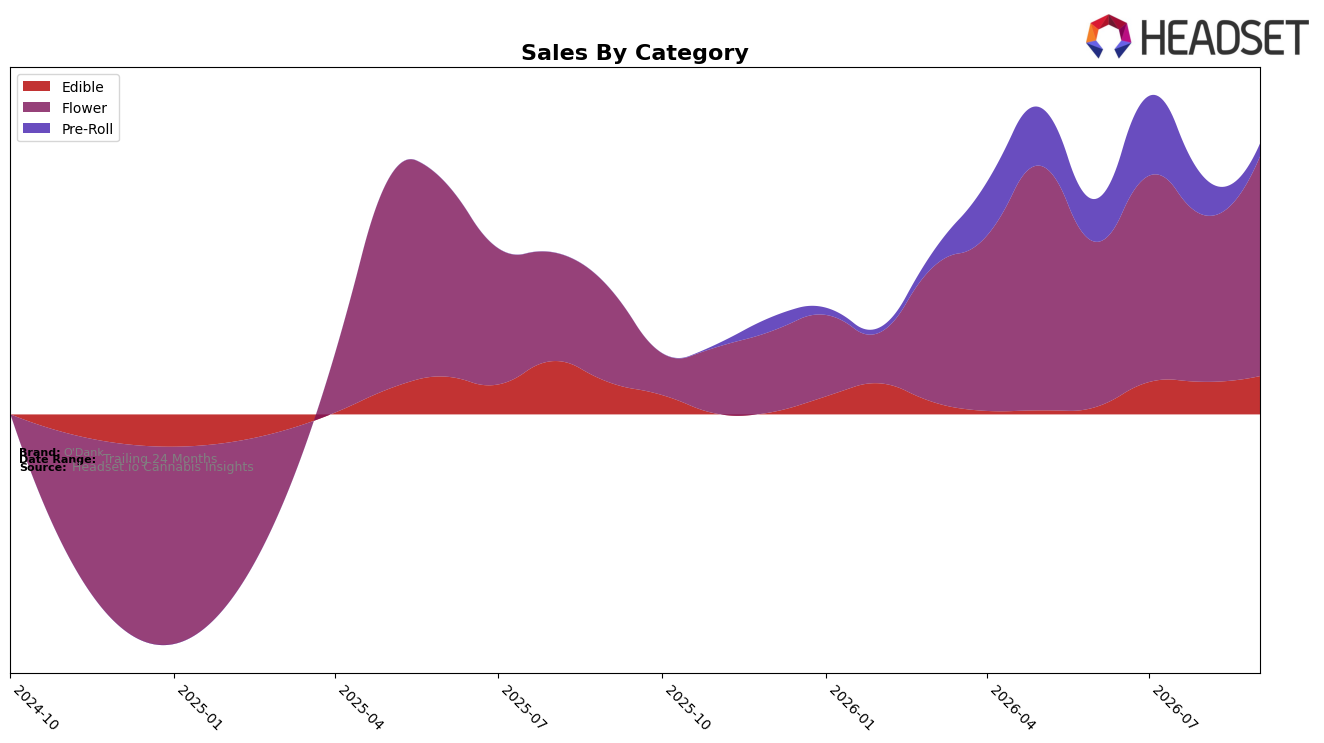
In September 2026, O'Dank’s mix skewed heavily to Flower at 81.21% share with 130.75% year-over-year growth and 31.92% month-over-month, while Edible held 14.09% share with 18.36% year-over-year and 17.79% month-over-month, and Pre-Roll slipped to 4.69% share with a -65.76% month-over-month change and no year-over-year basis. The brand’s overall sales rose 112.30% year-over-year alongside an average price decline of -18.04%, and Flower’s average price sat at $30.77 as Edible averaged 7.22 and Pre-Roll 14.44. With Flower anchoring both share and growth and Pre-Roll retracting sharply month-over-month, the pattern implies O'Dank is concentrating velocity in core Flower while reducing exposure to more volatile Pre-Roll, using lower prices to widen throughput.
Within Ohio Flower, O'Dank is ranked 33, while Flower’s 81.21% mix and 31.92% month-over-month surge contrasted with Pre-Roll’s -65.76% month-over-month drop signal a portfolio tilt toward high-volume Flower and away from smaller, more elastic segments. The 18.36% year-over-year growth in Edible at a 14.09% share, combined with a brand-wide -18.04% average price shift and 112.30% year-over-year sales increase, indicates price-led customer acquisition primarily in Flower with Edible as a secondary contributor. The implication is a positioning that monetizes scale in Flower to drive rank stability in Ohio while keeping Edible as a margin-flex buffer and deprioritizing Pre-Roll until demand volatility normalizes.
Competitive Landscape
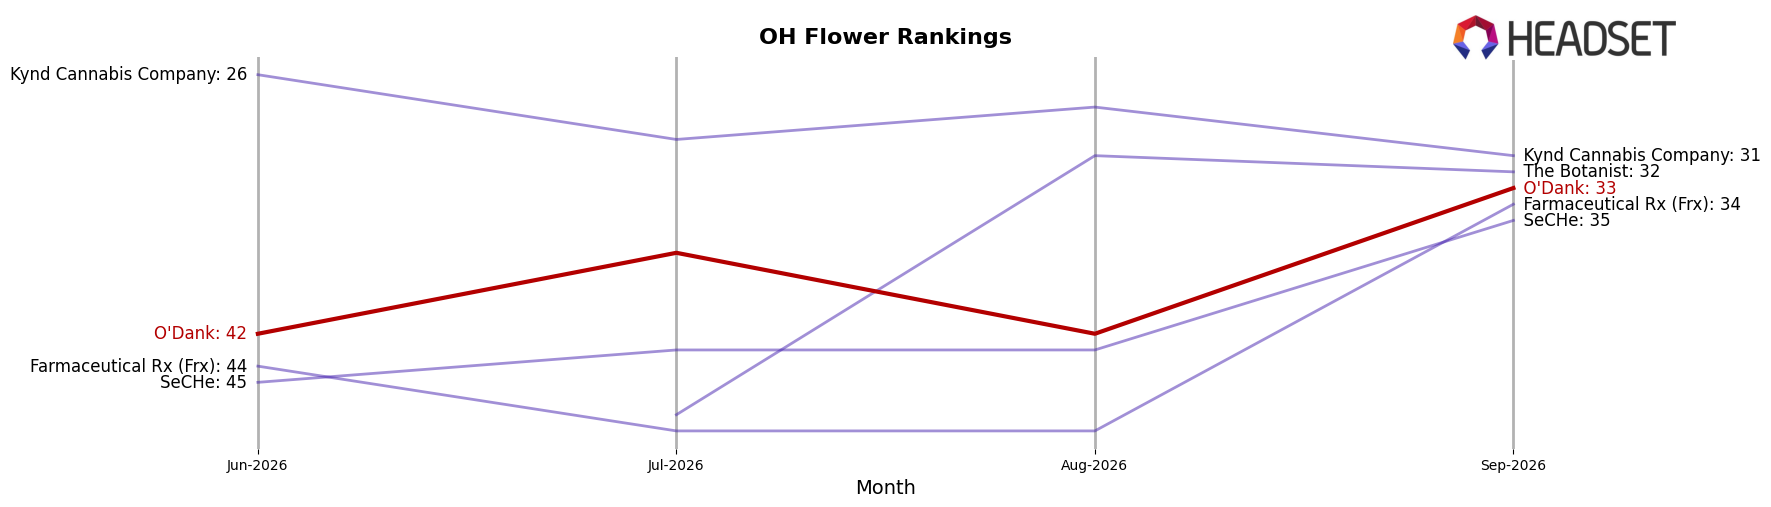
O'Dank sits at rank #33 in OH Flower in September 2026, improving 12 positions from #45 year over year, yet only 9 positions from #42 over the last three months, indicating a slower recent climb versus the annual change; by contrast, Klutch Cannabis advanced to #1 from #13 year over year while growing sales by 162.4%, and Northwoods Cannabis surged to #5 from #76 with a 105,837.8% sales increase, outpacing O'Dank’s trajectory. With a prior peak at #31 in May 2025 and a current position two slots below that peak, the mix of a 12-rank YoY gain and a 9-rank three-month shift implies momentum that is positive but lagging the leaders, suggesting O'Dank must accelerate share capture to avoid being boxed out by faster-movers at the top.
Notable Products
Lemon Gummies 10-Pack (100mg) posted the standout move in September 2026 with an 80.6% month-over-month surge and a climb to rank 3, signaling a pivot toward Edibles even as H.F.C.S. (3.5g) held rank 1. GG4 (3.5g) advanced 18.6% MoM to rank 2 while Watermelon Gummies 10-Pack (100mg) slipped 4.5% MoM at rank 5, and four of the top ten are Flower SKUs concentrated in 3.5g formats. The dollar gap between Flower leaders and Edibles persists with H.F.C.S. (3.5g) at $90,834 versus mid-tier Edibles, yet the Edible rank gains indicate basket expansion beyond inhalables. The pattern implies O'Dank is gradually rebalancing from a Flower-led lineup toward a dual-engine mix where Edibles provide incremental velocity alongside flagship Flower.
Top Selling Cannabis Brands






Data for this report comes from real-time sales reporting by participating cannabis retailers via their point-of-sale systems, which are linked up with Headset’s business intelligence software. Headset’s data is very reliable, as it comes digitally direct from our partner retailers. However, the potential does exist for misreporting in the instance of duplicates, incorrectly classified products, inaccurate entry of products into point-of-sale systems, or even simple human error at the point of purchase. Thus, there is a slight margin of error to consider. Brands listed on this page are ranked in the top twenty within the market and product category by total retail sales volume.

