.svg)

Sep-2026
Sales
Trend
6-Month
Product Count
SKUs
Avg Price
YoY Sales Change
YoY Price Change


Where to Buy
Jay's by Bud's Goods is stocked at 47 licensed dispensaries across New Jersey and Massachusetts, 24 of them in New Jersey, with the deepest coverage in Atlantic City, Eatontown, Edgewater Park, Elmwood Park, and Ewing Township. Search by ZIP code or city below to find the closest one.
Market Insights Snapshot
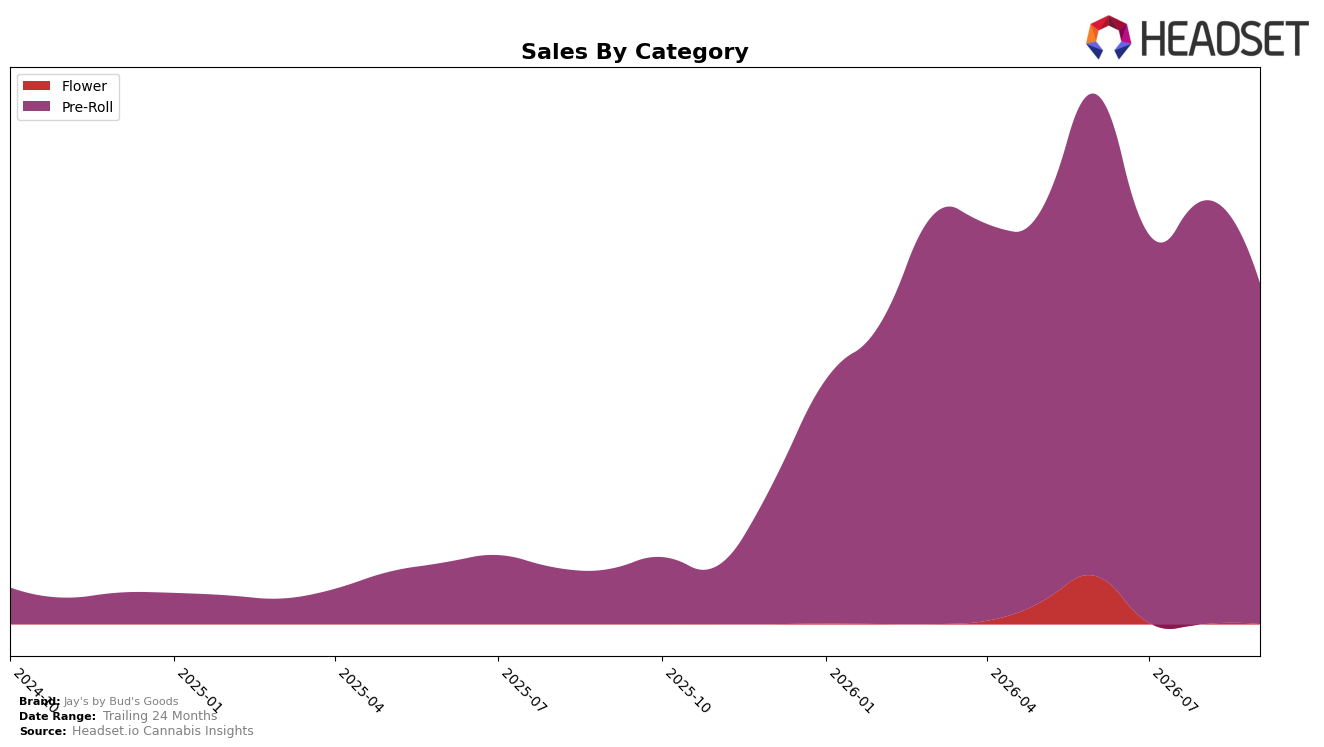
In September 2026, Jay's by Bud's Goods operated a single-category mix with Pre-Roll at 100.0% share, paired with a 524.8% year-over-year sales increase and a 19.5% month-over-month decline. Average price fell 37.1% year over year to $23.97 while the Pre-Roll category’s month-over-month sales dipped 19.5%, indicating a volume-led YoY expansion coupled with a seasonal or promotional pullback MoM. With Pre-Roll concentrated entirely in Massachusetts, the brand’s September 2026 rank of 27 in Pre-Roll places it mid-pack, implying that pricing-driven gains outpaced last year’s baseline but did not translate into upward rank momentum.
The combination of a 100.0% Pre-Roll mix and a 37.1% YoY price reduction suggests a deliberate volume-acquisition posture, while a 19.5% MoM decline and rank 27 indicate sensitivity to monthly demand swings and limited cushion against competitors’ price moves. Given a 524.8% YoY lift alongside a 19.5% MoM contraction, the brand’s positioning in Massachusetts Pre-Roll skews toward promotional elasticity rather than diversified resilience, implying that sustained share gains will depend on stabilizing price architecture or adding a second category to mitigate month-to-month variability.
Competitive Landscape
Jay's by Bud's Goods sits at rank #27 in Massachusetts Pre-Roll for September 2026, improving 81 positions from #108 year over year, yet slipping 6 spots from #21 in June 2026 after peaking at #19 in April 2026. In contrast, Jeeter held #1 year over year and remains #1 currently, while Northern Grown advanced from #10 to #5, indicating upward mobility among leaders as Jay's by Bud's Goods retreats from its April 2026 peak. This mix of a large YoY climb (+81 ranks) alongside a recent quarter-on-quarter step back (-6 ranks since June 2026) implies the brand’s gains are redistributive and at risk of erosion unless near-term momentum matches the pace of top-five climbers.

Notable Products
Dulce De Fresa Pre-Roll 2-Pack (1g) posted the steepest retreat in September 2026 at -48.9% MoM, dropping into rank 5, while Glitter Bomb Pre-Roll (1g) also contracted -22.6% MoM at rank 1. Tongue Splasher Pre-Roll 28-Pack (14g) fell -19.3% MoM at rank 9, and four of the top ten are 28-pack Party/Part/Tongue formats that cluster in ranks 8–10, indicating volume SKUs are present but losing momentum. Push OG Pre-Roll 2-Pack (1g) entered at rank 2 with $11,567, and Red Bullz Pre-Roll 2-Pack (1g) debuted at rank 3 without a MoM baseline, signaling a pivot toward fresh 2-pack entrants at the top. The pattern implies Jay's by Bud's Goods is concentrating demand in new 2-pack launches while legacy singles and bulk packs face pressure, pointing to a shift toward mid-size value over both solo grams and large-party formats.
Top Selling Cannabis Brands






Data for this report comes from real-time sales reporting by participating cannabis retailers via their point-of-sale systems, which are linked up with Headset’s business intelligence software. Headset’s data is very reliable, as it comes digitally direct from our partner retailers. However, the potential does exist for misreporting in the instance of duplicates, incorrectly classified products, inaccurate entry of products into point-of-sale systems, or even simple human error at the point of purchase. Thus, there is a slight margin of error to consider. Brands listed on this page are ranked in the top twenty within the market and product category by total retail sales volume.

