.svg)


Market Insights Snapshot
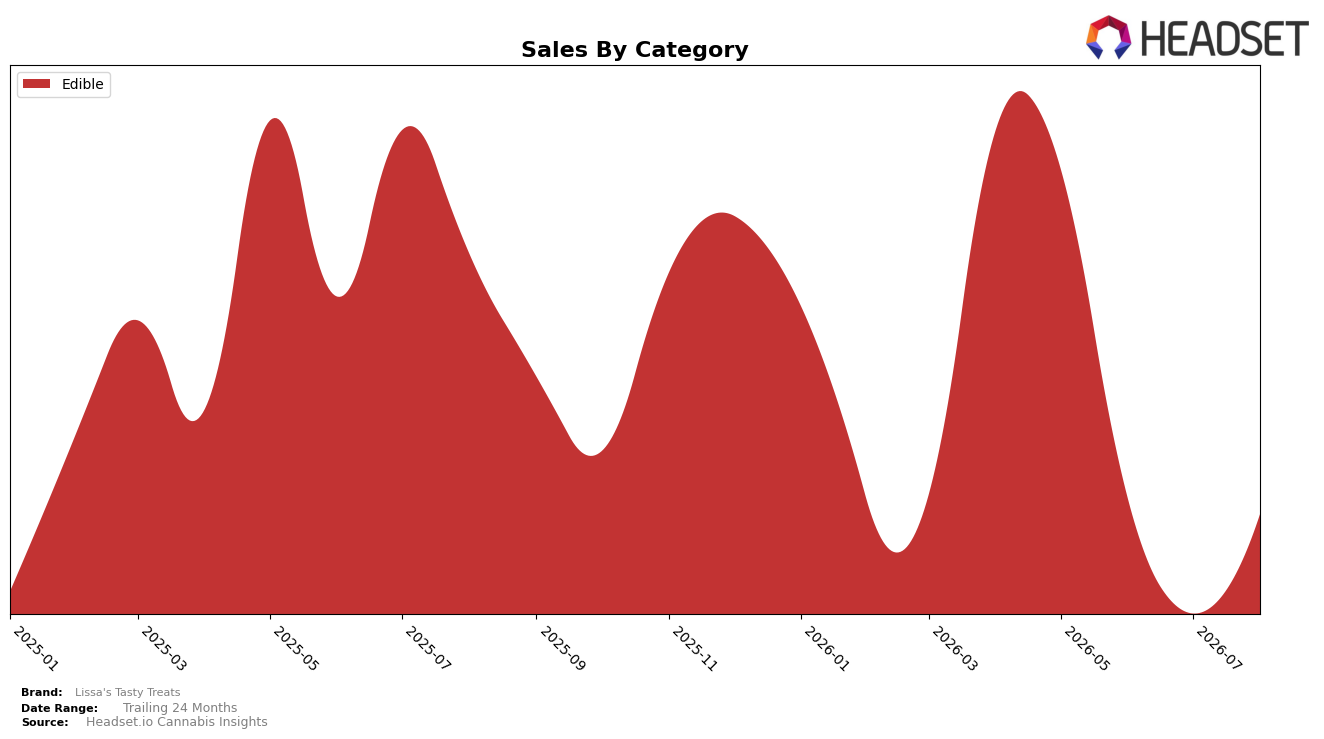
In August 2026, Lissa's Tasty Treats operated as a single-category brand with Edible at 100.0% category mix share and a month-over-month sales change of 103.03%, while year-over-year sales declined 57.11%. Average price moved down 9.96% YoY alongside the full reliance on Edible, and the absence of any other categories kept mix concentration at 100.0% even as MoM momentum accelerated by over 100%. With Oregon as the leading state and Edible as the only category, the pattern points to a narrow portfolio that rebounded MoM but contracted YoY, implying sensitivity to pricing and a single demand stream rather than diversified channel lift.
The combination of a 57.11% YoY decline and a 103.03% MoM rebound—together with a 9.96% YoY price decrease—signals that Lissa's Tasty Treats is leaning on price elasticity to recapture volume within a single Edible lane, not cross-category breadth. With 100.0% of sales in Edible during August 2026 and Oregon as the top state, the brand’s positioning skews toward depth over diversification, which implies exposure to seasonal swings and promotional cycles rather than balanced, multi-category demand.
Competitive Landscape
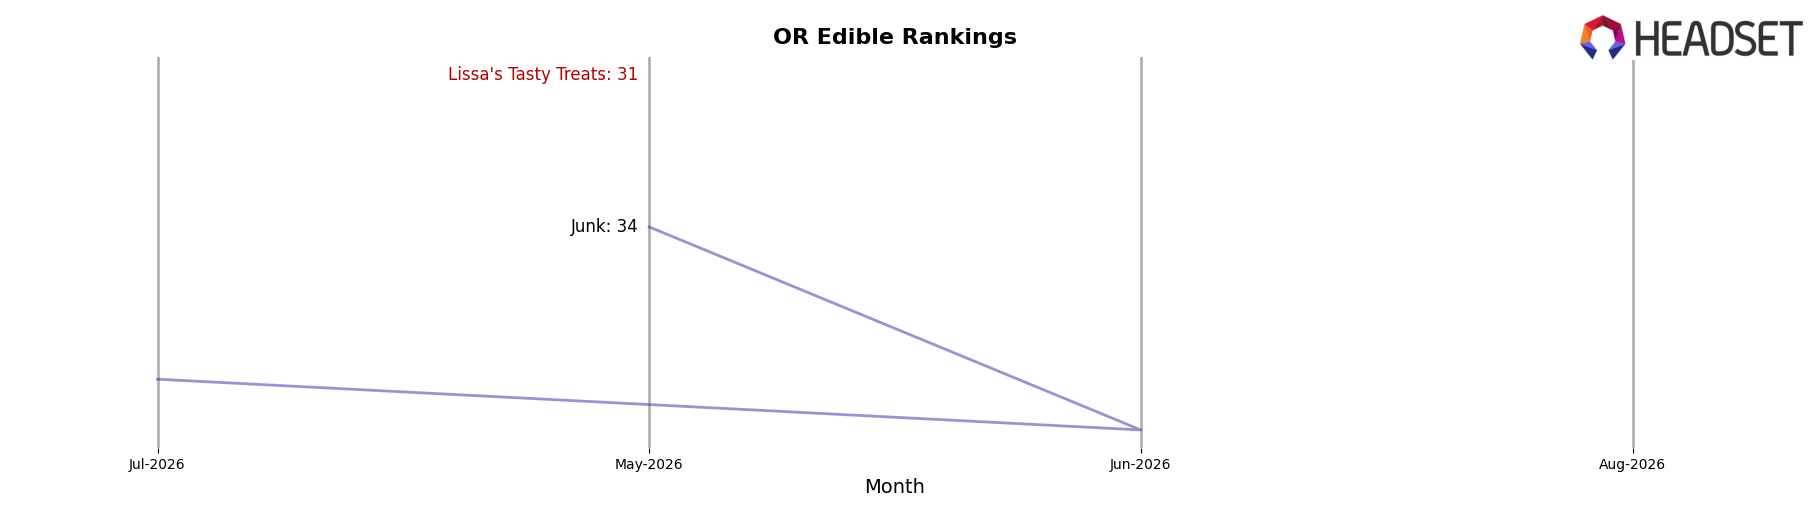
Lissa's Tasty Treats sits at rank #40 in OR Edible in August 2026, down 6 positions year over year from #34 and 9 positions from its three-month mark at #31 in May 2026, while category leaders moved differently: Wyld held #1 with a -1.5% YoY sales change and Mule Extracts stayed at #5 with a +2.8% YoY sales lift, indicating Lissa's Tasty Treats is losing relative momentum even as some top-five peers maintain or expand share; the gap between a May 2026 peak at #31 and an August 2026 position at #40, alongside leaders remaining fixed at #1–#5, implies a slide into a tougher mid-pack where recovery will require taking share from stable incumbents.
Notable Products
Snickerdoodle Cookie Bites 10-Pack (100mg) posted the steepest movement in August 2026 with a -37.0% month-over-month drop and slid to rank 2 behind a new leader, while Peanut Butter Cookie 10-Pack (100mg) entered at rank 1 with undisclosed prior-month movement. Chocolate Chip Cookie Bites 10-Pack (100mg) held rank 3 with no reported month-over-month figure, and three of the top three SKUs are all Edible cookies, concentrating category exposure even as one core SKU contracted by -37.0%. The absence of Gingersnap Cookie 10-Pack (100mg) from the ranking alongside a leadership handoff at rank 1 signals a pivot toward fewer hero SKUs carrying share, implying that Lissa's Tasty Treats is consolidating demand around a narrower cookie lineup despite volatility in rank 2.
Top Selling Cannabis Brands






Data for this report comes from real-time sales reporting by participating cannabis retailers via their point-of-sale systems, which are linked up with Headset’s business intelligence software. Headset’s data is very reliable, as it comes digitally direct from our partner retailers. However, the potential does exist for misreporting in the instance of duplicates, incorrectly classified products, inaccurate entry of products into point-of-sale systems, or even simple human error at the point of purchase. Thus, there is a slight margin of error to consider. Brands listed on this page are ranked in the top twenty within the market and product category by total retail sales volume.

