.svg)

Sep-2026
Sales
Trend
6-Month
Product Count
SKUs
Avg Price
YoY Sales Change
YoY Price Change


Market Insights Snapshot
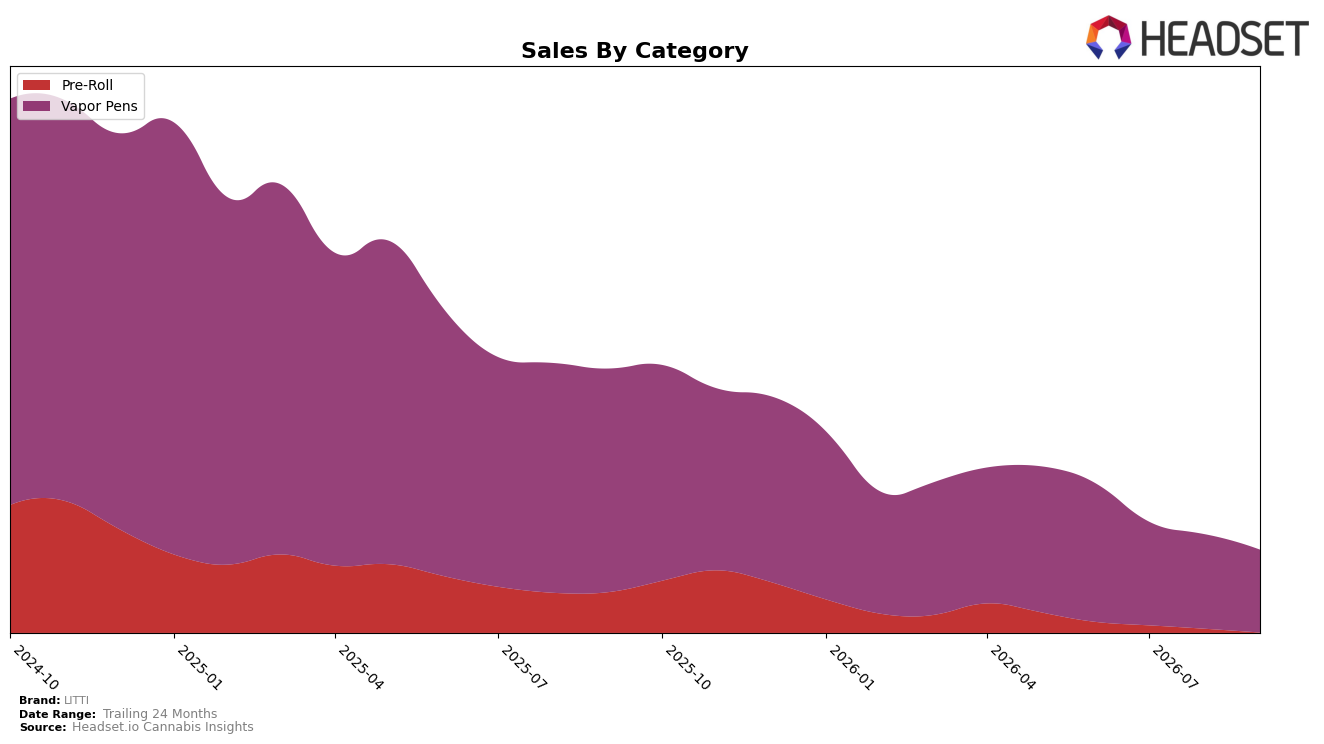
LITTI’s category mix in September 2026 is concentrated in Vapor Pens at 90.36% share (rank 25 in Ontario), with Pre-Roll at 9.64% share; within this split, Vapor Pens declined 60.38% year over year and 11.22% month over month, while Pre-Roll fell 80.39% year over year and 27.74% month over month. Against this backdrop, overall brand sales were down 63.93% year over year and 76.997% versus 24 months, while average price rose 10.77%, implying a mix-and-price tension where a premiumizing core (average price $30.02) is not offsetting volume losses, and the heavier drag in Pre-Roll versus Vapor Pens suggests concentration is limiting downside but not reversing it.
The sharper contractions in Pre-Roll (−80.39% YoY, −27.74% MoM) relative to Vapor Pens (−60.38% YoY, −11.22% MoM), combined with a 90.36% dependency on Vapor Pens and a 10.77% average price increase, imply LITTI is effectively repositioning around a narrower, higher-priced Vapor Pens core at the expense of breadth. With Vapor Pens at rank 25 in Ontario and Pre-Roll losing both share and velocity, the pattern implies a defensive focus: preserve relevance where elasticities are less punitive, even if that constrains scale, which positions the brand to stabilize within a single category rather than pursue multi-category reach.
Competitive Landscape
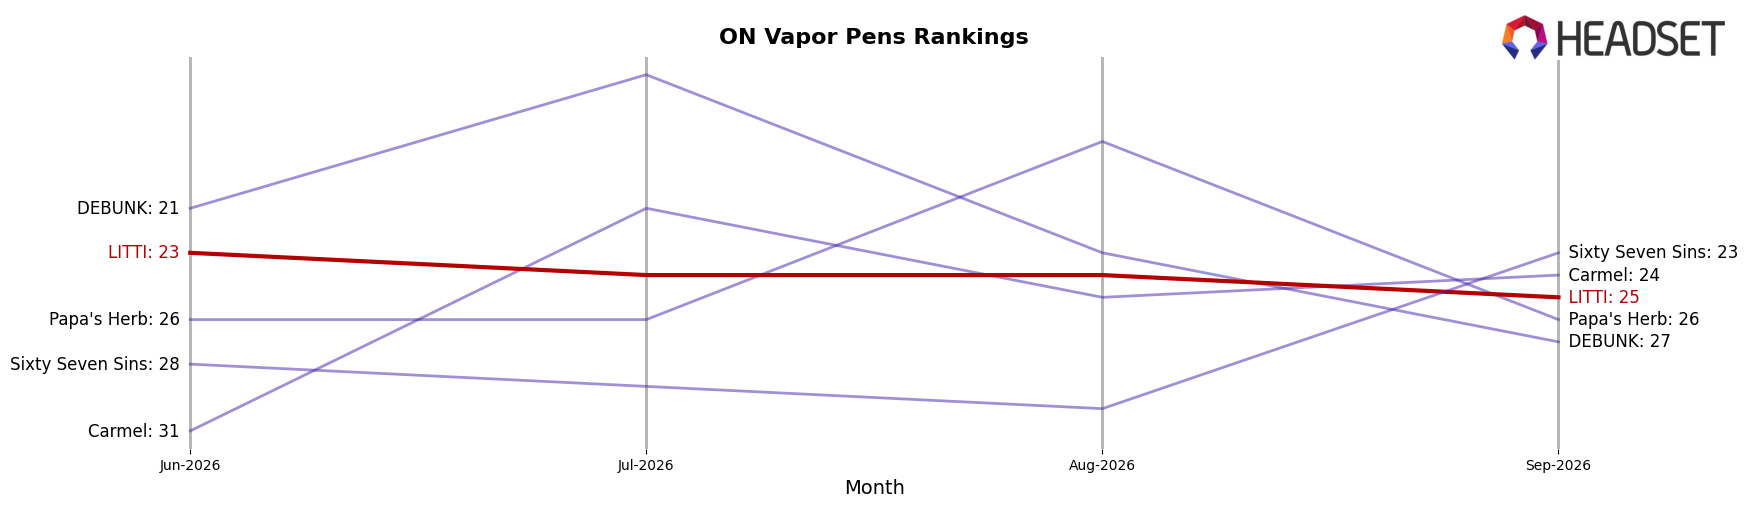
LITTI sits at rank #25 in ON Vapor Pens in September 2026, down 10 positions YoY from #15, and off 2 spots from June 2026’s #23; its peak was #8 in October 2024, indicating a 17-rank slide from peak to current. In contrast, Spinach climbed from #4 to #1 alongside a 172.5% YoY sales increase, while Kolab moved from #14 to #5 with 93.0% YoY growth, pointing to share consolidation among faster-advancing rivals; by comparison, General Admission rose from #3 to #4 despite an 12.0% YoY sales decline, indicating rank mobility detached from pure growth rates. The combination of a 10-position YoY drop and a 2-position slip since June 2026 implies LITTI’s trajectory is losing shelf visibility as competitors ascend, requiring a pivot to regain mid-tier positioning.
Notable Products
Cherry Chonk Liquid Diamonds Disposable (1g) posted the steepest decline at -27.3% while dropping to rank 5, and Sunrise Smash Liquid Diamonds Cartridge (1g) fell -10.1% at rank 4, together signaling pressure on the Liquid Diamonds line despite Slappn' Berry Distillate Cartridge (1g) rising 15.6% to rank 1. With eight of the top ten in Vapor Pens and Watermelon Whammy Liquid Diamonds Cartridge (1g) up 8.8% at rank 3, the mix skews heavily to pens even as Bussn' Blackberry Distillate Cartridge (1g) slid -37.2% to rank 10. The concentration in Vapor Pens coupled with divergent movements between Distillate gains and Liquid Diamonds softness implies LITTI is tilting toward distillate-led hero SKUs while reassessing Liquid Diamonds positioning in September 2026.
Top Selling Cannabis Brands






Data for this report comes from real-time sales reporting by participating cannabis retailers via their point-of-sale systems, which are linked up with Headset’s business intelligence software. Headset’s data is very reliable, as it comes digitally direct from our partner retailers. However, the potential does exist for misreporting in the instance of duplicates, incorrectly classified products, inaccurate entry of products into point-of-sale systems, or even simple human error at the point of purchase. Thus, there is a slight margin of error to consider. Brands listed on this page are ranked in the top twenty within the market and product category by total retail sales volume.

