Market Insights Snapshot
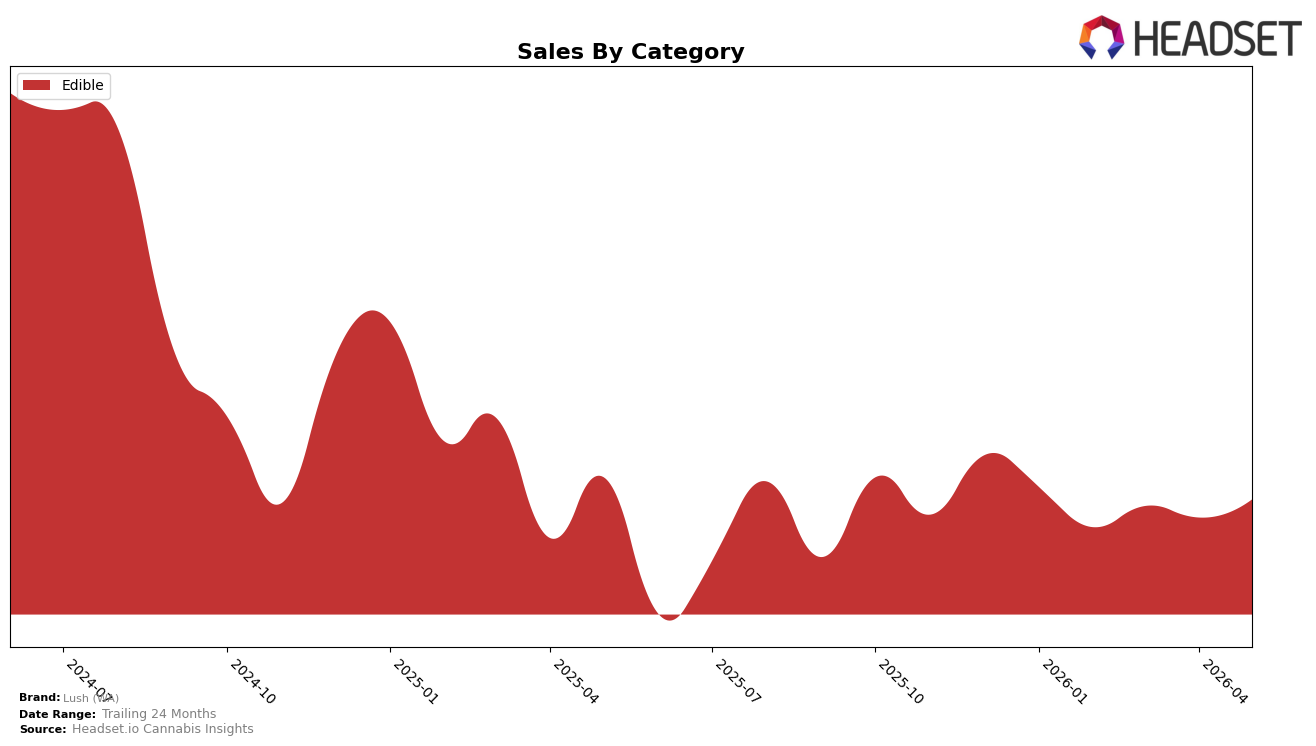
In May 2026, Lush (WA) operated as a single-category brand with Edible accounting for 100.0% of sales, placing the brand squarely in a concentrated mix rather than a diversified portfolio. Within that mix, Edible sales declined year over year by 2.63% while improving month over month by 2.23%, and the average price slipped 0.58% YoY, indicating a mild price-related drag against a short-term unit lift. The brand ranked 22 in Edible within Washington, juxtaposed with a 33.98% two-year sales decline and the current month’s 2.23% MoM uptick, implying that short-cycle momentum has not yet closed the longer-cycle gap.
The pattern suggests that full reliance on Edible (100.0% share) concentrates risk and ties positioning to a single demand curve, where a 0.58% YoY price decrease and a 2.63% YoY sales decline point to volume not fully offsetting price pressure. With a 22 rank in Washington Edible and a 2.23% MoM gain, the brand’s immediate traction is occurring within mid-tier placement, implying that near-term share capture likely requires sharper price-pack architecture or sub-segment focus rather than broad expansion, given the 33.98% 24-month contraction.
Competitive Landscape
Lush (WA) sits at rank #22 in WA Edible for May 2026, down 2 positions from #20 year over year, and off 1 spot from #21 in February 2026, while its historical peak was #16 in August 2024; in contrast, Wyld held #1 both this month and a year ago with a 25.9% year-over-year sales increase, and Hot Sugar remained #3 despite an 8.1% sales decline year over year, indicating that Lush (WA)’s 2-rank YoY slippage amid stable top-tier positions suggests a gradual erosion in competitive position rather than a transient dip.

Notable Products
Lush - Mango Lime Gummy 10-Pack (100mg) posted the steepest decline in May 2026 at -15.88% MoM while holding rank 4, and Lush - CBN/THC 1:2 Cloudberry Fruit Chews 10-Pack (50mg CBN, 100mg THC) fell -15.70% at rank 6, signaling erosion in non-CBD minor-cannabinoid SKUs. In contrast, Lush- CBD/THC 1:1 Ginger Peach Chews 10-Pack (100mg CBD, 100mg THC) jumped 42.70% MoM to rank 8 as Lush - CBD/THC 1:1 Strawberry Soft Chews 10-Pack (100mg CBD, 100mg THC) rose 10.79% at rank 5, implying CBD 1:1 profiles are pulling share from CBN/THC and flavor-led THC gummies. With all top-10 items in Edible and four of the top ten in CBD 1:1 formats, the product mix skews toward functional balance rather than higher-dose sedation, suggesting assortment and promo weight should pivot to CBD-inclusive 1:1 chews while pruning underperforming CBN-led variants.
Top Selling Cannabis Brands
Data for this report comes from real-time sales reporting by participating cannabis retailers via their point-of-sale systems, which are linked up with Headset’s business intelligence software. Headset’s data is very reliable, as it comes digitally direct from our partner retailers. However, the potential does exist for misreporting in the instance of duplicates, incorrectly classified products, inaccurate entry of products into point-of-sale systems, or even simple human error at the point of purchase. Thus, there is a slight margin of error to consider. Brands listed on this page are ranked in the top twenty within the market and product category by total retail sales volume.

