Jun-2026
Sales
Trend
6-Month
Product Count
SKUs
Avg Price
YoY Sales Change
YoY Price Change
Market Insights Snapshot
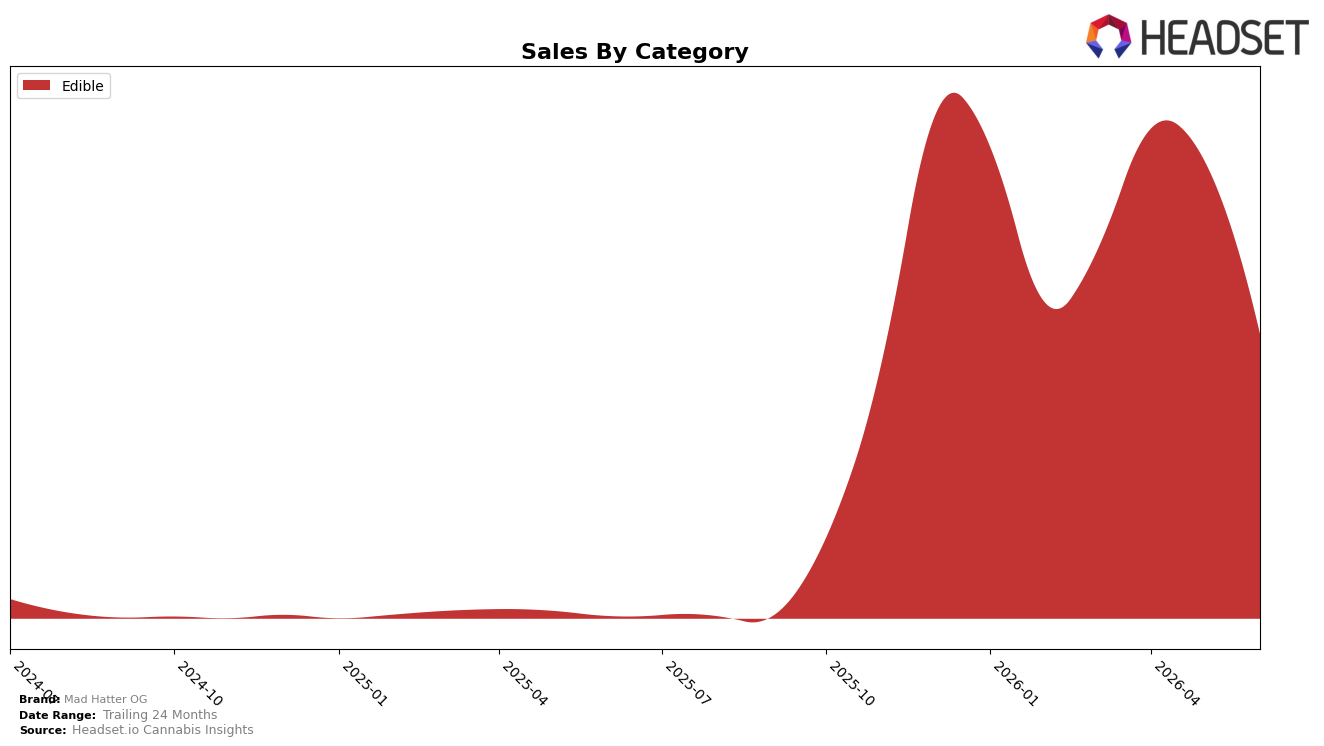
Mad Hatter OG operated as a single-category brand in June 2026, with Edible accounting for 100.0% of sales and holding rank 16 within Edible in Saskatchewan. Within that all-in Edible focus, year-over-year sales rose 7,319.5% while month-over-month sales declined 37.7%, and average price climbed 330.1% year over year to $25.76. The combination of a 100.0% category allocation and a rank of 16 indicates a concentrated bet that scaled rapidly versus June 2025 but contracted versus May 2026, implying a volume pullback amid materially higher prices.
The shift toward higher pricing (+330.1% YoY) alongside a 37.7% MoM sales decline, against a 100.0% Edible mix and a category rank of 16, implies that Mad Hatter OG is trading up within Edibles rather than diversifying into other formats. The pattern suggests a positioning anchored in premiumized Edibles where price per unit rises faster than share rank improvement, meaning June 2026 likely prioritized margin per unit over breadth of assortment or rank ascent within Saskatchewan.
Competitive Landscape
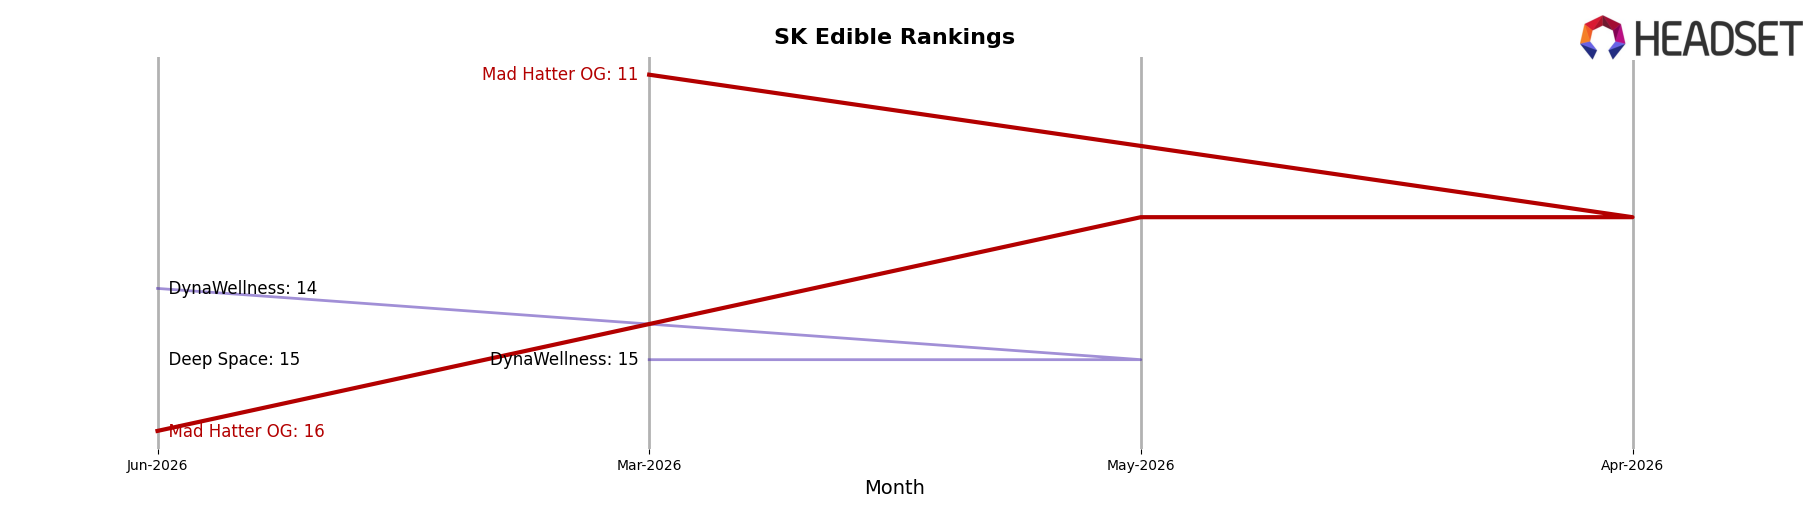
Mad Hatter OG sits at rank #16 in SK Edible in June 2026, with no year-over-year rank available and a 5-position slide from #11 in March 2026 to #16 in June 2026; that 3-month drop contrasts with Wyld holding #1 while lifting sales by 2.7% year over year and with Wana surging from #20 to #4 alongside a 4,937.1% sales increase, indicating the competitive gap widened despite Mad Hatter OG’s prior peak. The shift from #11 to #16 places Mad Hatter OG below faster-rising peers such as Shred at #3 with 110.6% YoY growth and Gron / Grön moving from #4 to #5 with 55.6% YoY growth, implying that without a near-term catalyst on velocity or distribution, the brand’s rank trajectory points toward further share pressure rather than recovery.
Notable Products
Delta-8/THC 10:1 Raspberry Lime Zinger Gummies 10-Pack (100mg Delta-8, 10mg THC) led June 2026 with a rank of 1 but posted a -37.7% month-over-month drop, indicating demand cooled even as it held the top position. With only one ranked SKU in the Edible category and other lines absent from the top ten, the assortment is concentrated in a single format while breadth thinned. The absence of Mango Habanero Soft Chews 2-Pack (10mg) from the rankings alongside a -37.7% decline in the lead SKU implies reliance on a narrow Edible lineup that is losing momentum.
Top Selling Cannabis Brands
Data for this report comes from real-time sales reporting by participating cannabis retailers via their point-of-sale systems, which are linked up with Headset’s business intelligence software. Headset’s data is very reliable, as it comes digitally direct from our partner retailers. However, the potential does exist for misreporting in the instance of duplicates, incorrectly classified products, inaccurate entry of products into point-of-sale systems, or even simple human error at the point of purchase. Thus, there is a slight margin of error to consider. Brands listed on this page are ranked in the top twenty within the market and product category by total retail sales volume.

