Jun-2026
Sales
Trend
6-Month
Product Count
SKUs
Avg Price
YoY Sales Change
YoY Price Change
Market Insights Snapshot
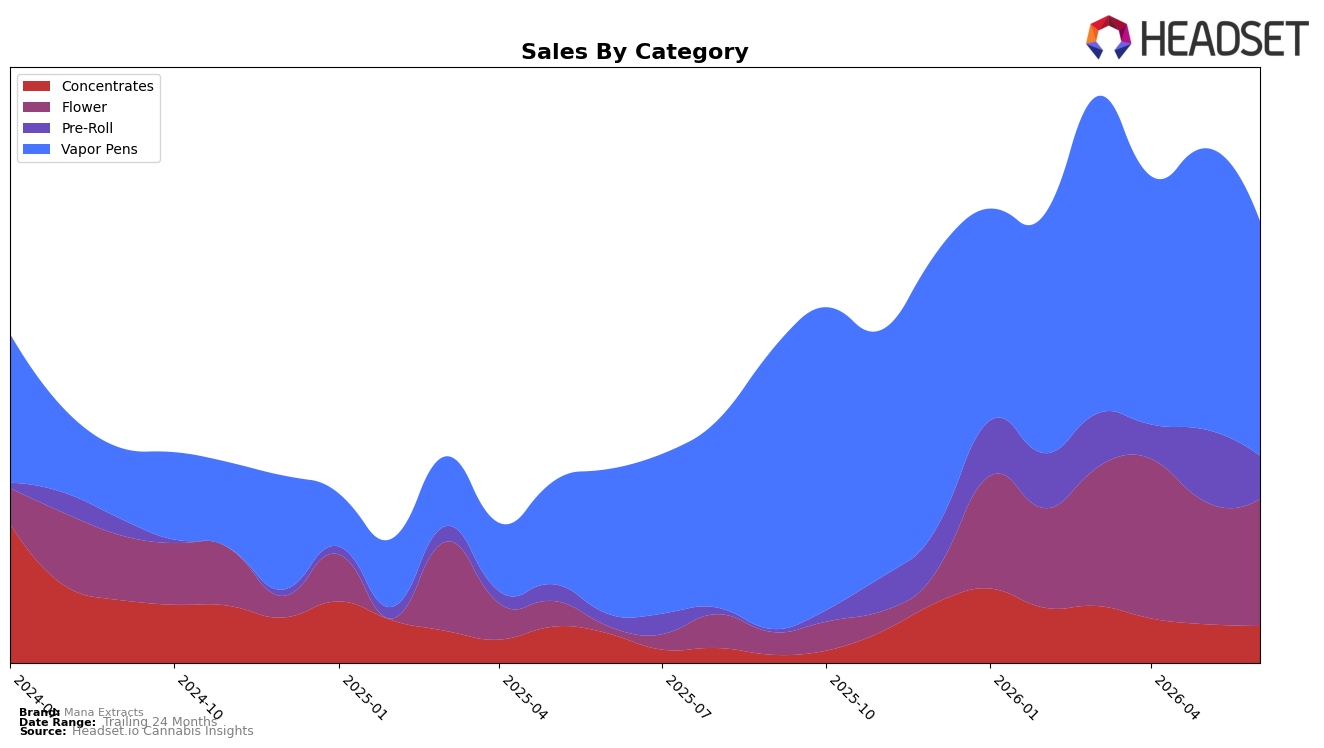
Mana Extracts concentrated over half of June 2026 sales in Vapor Pens at 52.0% share, where category sales rose 60.1% year over year but fell 16.3% month over month, while Flower expanded to 28.6% share with a 1024.4% year-over-year surge and a 3.3% month-over-month gain. Pre-Roll contributed 10.4% share with 187.4% year-over-year growth but declined 37.5% month over month, and Concentrates held 9.0% share with 22.2% year-over-year growth and a 4.2% month-over-month dip. The average price across the brand rose 8.5% year over year as Vapor Pens carried a higher $17.00 average and Pre-Roll sat at $7.25, implying mix-led pricing lift even as Vapor Pens volume softened month over month; the pattern points to a pivot toward Flower and sustained dependence on Vapor Pens that exposes short-term volatility.
With Vapor Pens ranked 24th in Oregon and down 16.3% month over month alongside a 3.3% month-over-month gain in Flower, the portfolio is tilting toward higher-growth Flower while maintaining a large Vapor Pens base. The 1024.4% year-over-year Flower surge and 187.4% Pre-Roll growth versus a 22.2% increase in Concentrates, combined with the 8.5% brand-level price rise, indicate pricing headroom in value-oriented formats and a need to defend Vapor Pens share at rank 24; the implication is that positioning should emphasize Flower-driven acquisition while stabilizing Vapor Pens to smooth month-to-month swings.
Competitive Landscape
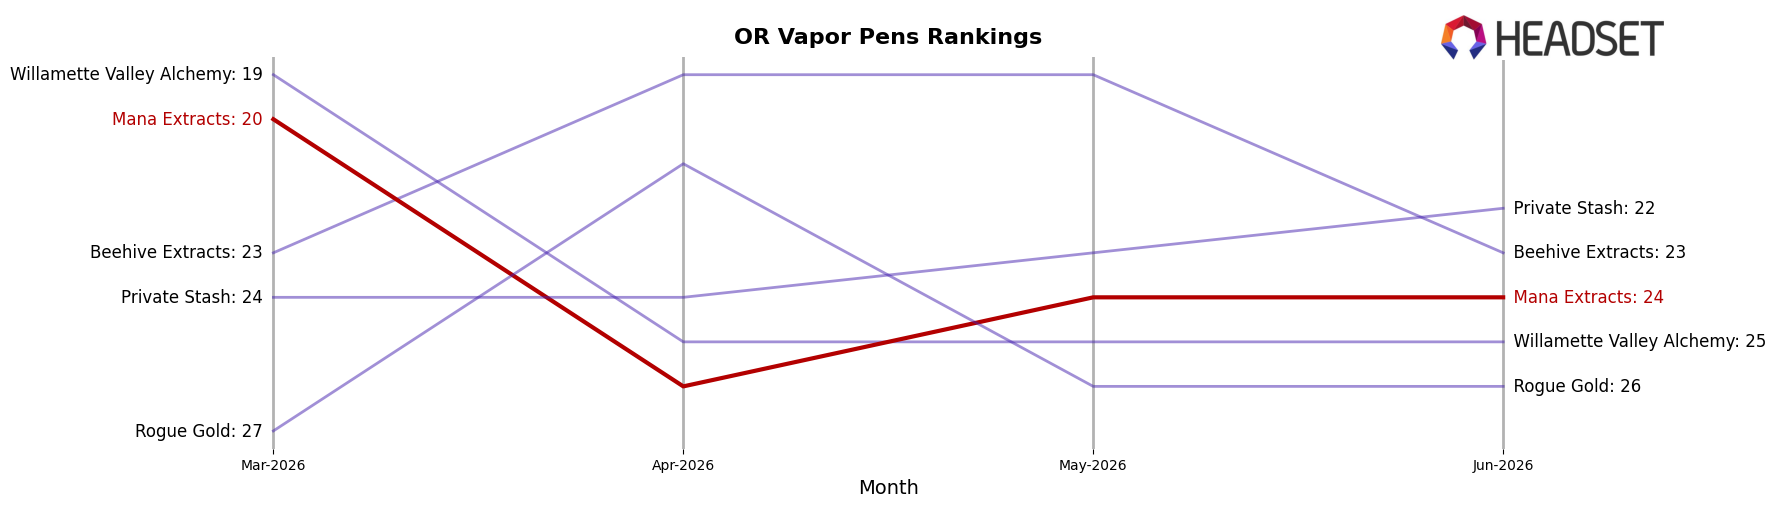
Mana Extracts sits at rank #24 in OR Vapor Pens in June 2026, improving 9 positions year over year from #33 but slipping 4 positions since March 2026 when it peaked at #20; meanwhile, Buddies holds #1 after rising from #2 and FRESHY climbed from #5 to #2, whereas Entourage Cannabis / CBDiscovery fell from #1 to #3 alongside a -38.9% sales change. The combination of a year-over-year rank gain of 9 places and a quarter-over-quarter drop of 4 places, against competitors advancing multiple spots into the top 3, implies Mana Extracts is recovering year over year but losing momentum versus accelerating leaders, pointing to pressure to defend share in the mid-20s tier.
Notable Products
Runtz Crumble Infused Pre-Roll (1g) posted the steepest decline at -61.1% month over month while sliding to rank 7, and Blue Dream Cured Resin Cartridge (1g) fell -39.3% at rank 3, indicating sharp volatility in two top-10 SKUs. Meanwhile, Mimosa Crumble Infused Pre-Roll (1g) rose +46.5% to rank 2, and three Vapor Pens SKUs occupied ranks 3, 4, and 5, pointing to category concentration despite uneven momentum. With Blueberry Muffin (Bulk) at rank 1 and $37,798 in June 2026 sales against a -28.3% drop for Sundae Driver (1g) at rank 10, Flower shows a split between a leading bulk play and softer packaged grams. The pattern implies Mana Extracts is leaning into a two-pronged mix where bulk Flower anchors share while Pre-Roll volatility and mid-pack Vapor Pens concentration signal a need to stabilize infused Pre-Rolls to convert category presence into consistent rank gains.
Top Selling Cannabis Brands
Data for this report comes from real-time sales reporting by participating cannabis retailers via their point-of-sale systems, which are linked up with Headset’s business intelligence software. Headset’s data is very reliable, as it comes digitally direct from our partner retailers. However, the potential does exist for misreporting in the instance of duplicates, incorrectly classified products, inaccurate entry of products into point-of-sale systems, or even simple human error at the point of purchase. Thus, there is a slight margin of error to consider. Brands listed on this page are ranked in the top twenty within the market and product category by total retail sales volume.

