.svg)
Sep-2026
Sales
Trend
6-Month
Product Count
SKUs
Avg Price
YoY Sales Change
YoY Price Change


Market Insights Snapshot
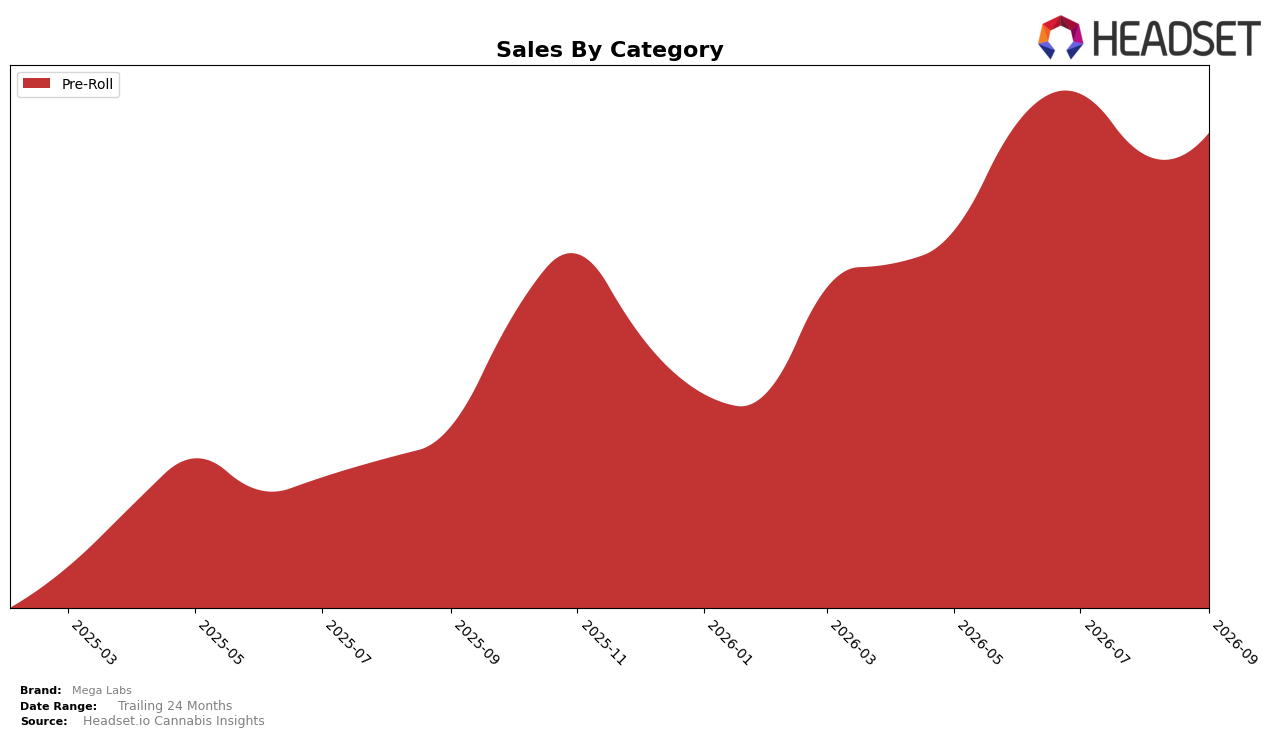
In September 2026, Mega Labs operated as a single-category brand in Pre-Roll with a 100.0% mix, posting 160.7% YoY sales growth and a 4.9% MoM lift while average price declined 13.3% YoY to $8.46. Within Massachusetts Pre-Roll, the brand held rank 25, indicating volume expansion outpacing price declines but not yet translating into a top-20 position; the pattern implies a scale-through-value stance where share gains hinge on sustaining higher unit velocity at mid-pack rank.
The combination of a 13.3% YoY price reduction and 160.7% YoY sales growth, alongside a 4.9% MoM rise concentrated entirely in Pre-Roll, points to a deliberate price-to-volume trade that prioritizes penetration over premium. Holding rank 25 in Massachusetts while running a 100.0% Pre-Roll concentration implies positioning as a value-led specialist: to improve rank, the brand’s next lever is either deeper pricing to accelerate unit share or selective premium line extensions to raise mix and margin without eroding the current volume engine.
Competitive Landscape
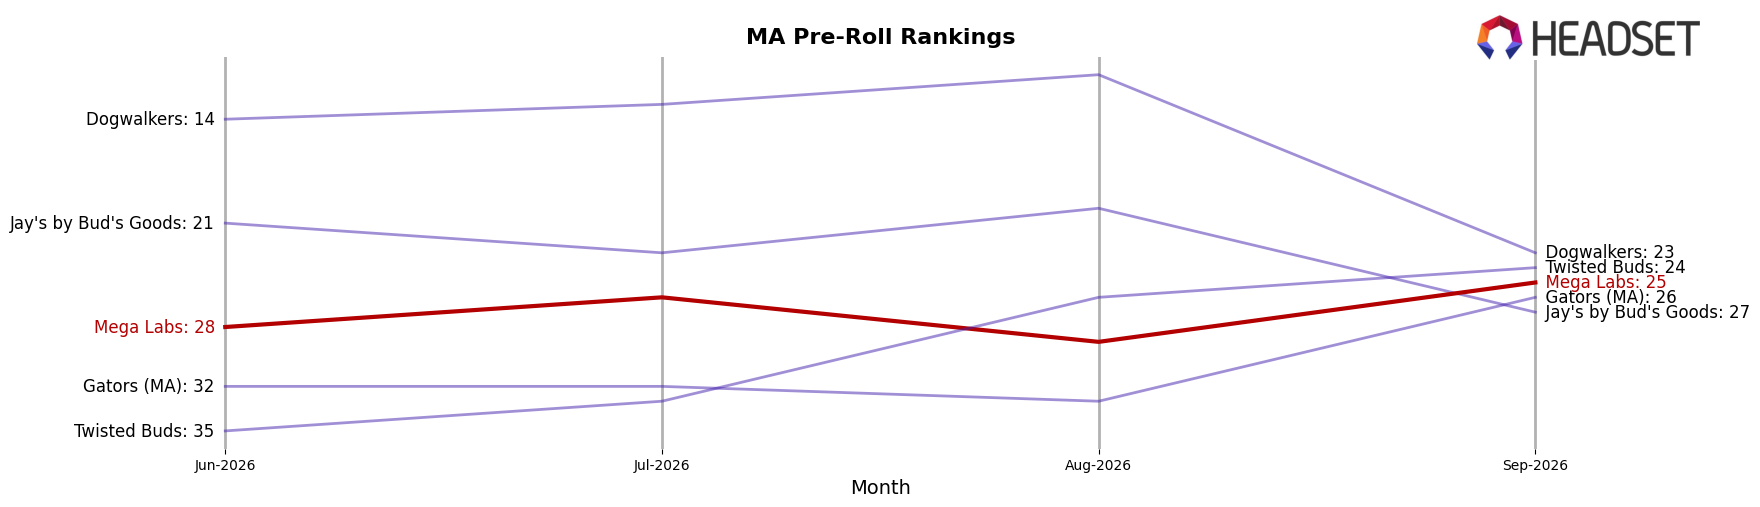
Mega Labs sits at rank #25 in MA Pre-Roll in September 2026, rising 45 positions from #70 year over year, and edging up 3 spots from #28 in June 2026; this new peak rank of #25 in September 2026 contrasts with Jeeter holding steady at #1 year over year and Northern Grown climbing from #10 to #5 alongside a 97.6% YoY sales gain, indicating Mega Labs is improving rank faster than its recent-quarter trend but still lagging top-tier momentum, which implies the trajectory points to mid-pack consolidation rather than imminent top-10 entry without further share capture.
Notable Products
Wavez - Apples & Bananas Infused Pre-Roll (1g) led September 2026 with a +125% month-over-month surge to rank 1, while Wavez - Blackberry Kush Infused Pre-Roll (1g) fell -35% at rank 10; this split suggests consumers are rewarding flavor-forward refreshes while aging SKUs lose velocity. Waves- Blue Raspberry Infused Pre-Roll (1g) jumped +97% into rank 2, and Waves- Grape Soda Infused Pre-Roll (1g) rose +40% at rank 3, indicating momentum is concentrated at the very top of the lineup. Eight of the top ten are Pre-Roll SKUs within the Waves/Wavez family, and the category’s center of gravity has shifted toward high-growth fruit profiles over legacy variants. The mix implies Mega Labs is tilting assortment and marketing toward a few breakout pre-roll flavors to capture rapid-turn pockets rather than spreading demand evenly across the catalog.
Top Selling Cannabis Brands






Data for this report comes from real-time sales reporting by participating cannabis retailers via their point-of-sale systems, which are linked up with Headset’s business intelligence software. Headset’s data is very reliable, as it comes digitally direct from our partner retailers. However, the potential does exist for misreporting in the instance of duplicates, incorrectly classified products, inaccurate entry of products into point-of-sale systems, or even simple human error at the point of purchase. Thus, there is a slight margin of error to consider. Brands listed on this page are ranked in the top twenty within the market and product category by total retail sales volume.

