Market Insights Snapshot
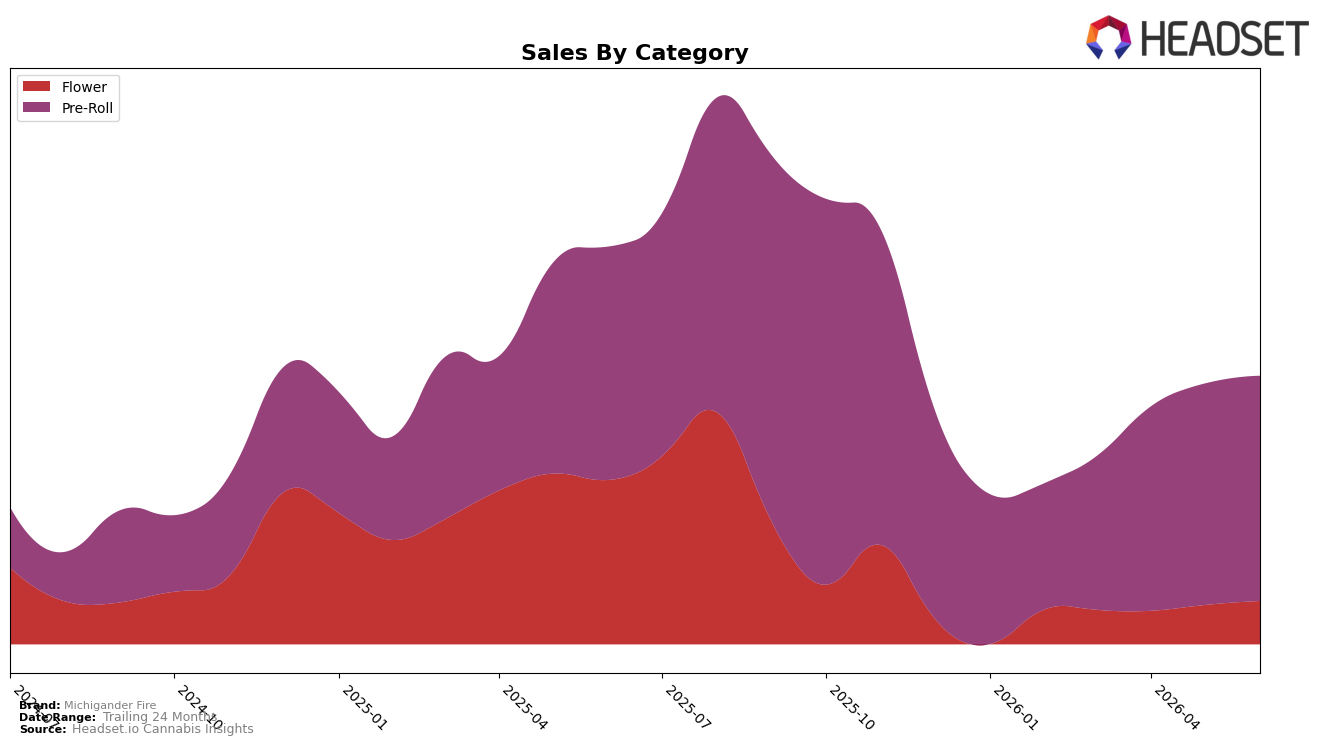
Michigander Fire concentrated 72.24% of June 2026 sales in Pre-Roll while Flower accounted for 27.76%, with Pre-Roll down 2.68% year over year but up 1.28% month over month, and Flower down 51.60% year over year but up 3.68% month over month. Despite a brand-level year-over-year sales decline of 24.00% alongside a 26.13% year-over-year increase in average price to $16.29, category dynamics were uneven: the Pre-Roll anchor softened modestly YoY as Flower contracted sharply, while both categories posted modest MoM gains, implying a mix that is stabilizing tactically month to month but still compressing annually due to Flower’s retreat.
With Pre-Roll holding a 72.24% share and ranked 30th in Michigan Pre-Roll, the brand’s reliance on a single category creates exposure to rank pressure if incremental share shifts do not materialize, especially given Flower’s 51.60% YoY contraction versus only a 2.68% YoY decline in Pre-Roll. The combination of a 3.68% MoM lift in Flower and a 1.28% MoM lift in Pre-Roll suggests room to trade mix toward higher-price Flower (average $34.88 versus $13.52 in Pre-Roll) without sacrificing June momentum, implying that near-term positioning hinges on rebalancing mix to offset annual erosion while defending the current Pre-Roll rank.
Competitive Landscape
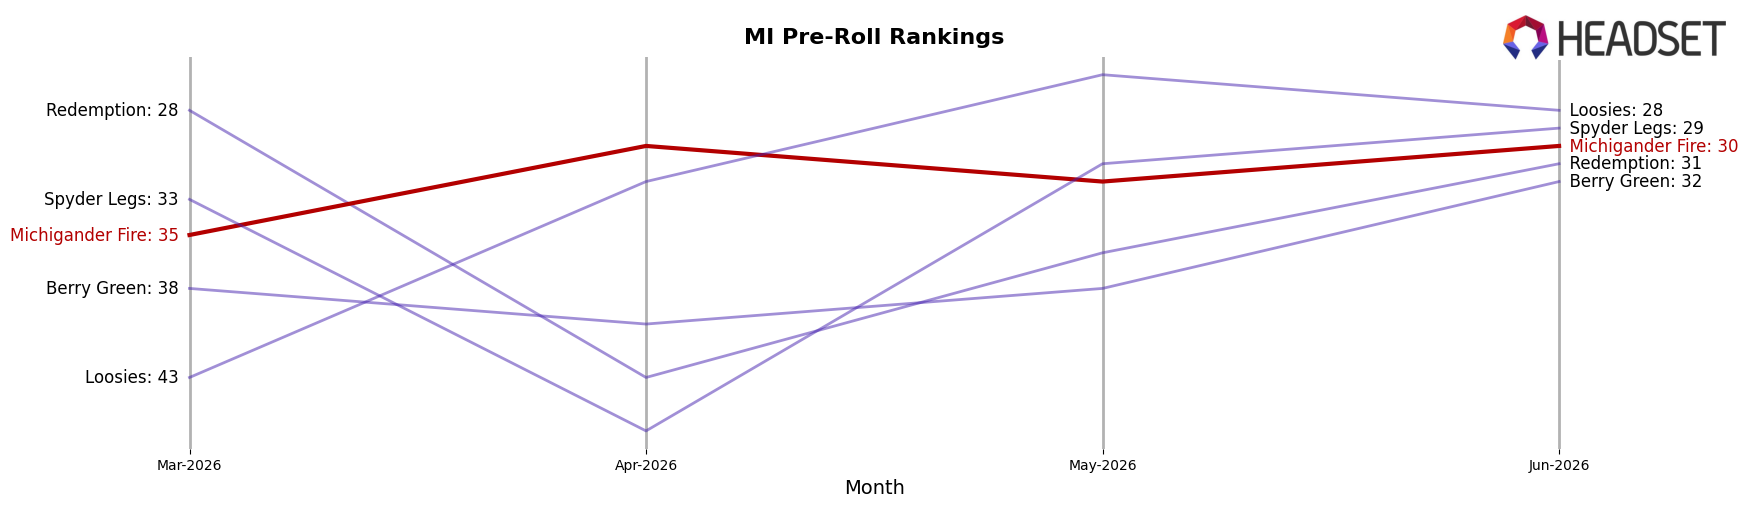
Michigander Fire sits at rank #30 in MI Pre-Roll for June 2026, down 6 positions year over year from #24, but up 5 spots from March 2026’s #35, indicating a recent quarter-on-quarter climb amid a longer-term slide from a peak of #14 in September 2025. Competitive context suggests share is consolidating at the top: Jeeter held #1 year over year while its sales fell 7.9%, whereas Mitten Extracts rose from #8 to #4 with 114.4% YoY sales growth, and Goodlyfe Farms slipped from #4 to #5 alongside a 32.3% YoY sales decline, implying that Michigander Fire’s mid-pack erosion alongside a short-term rebound reflects tightening headroom as momentum concentrates with a few ascendant players.
Notable Products
Trop Grape Cake Pre-Roll (1g) led the movement in June 2026 with a -45.23% month-over-month slide while holding rank 9, and Belgian Waffles Pre-Roll (1g) followed with a -44.47% decline at rank 7, indicating deep volatility in the mid-table even as Zazul Pre-Roll (1g) in rank 8 managed a +5.71% uptick. Pink Belts Pre-Roll (1g) sat at rank 1 and Flint Tropics Pre-Roll (1g) at rank 3, and five of the top six ranks were unchanged month-over-month given nulls while the two sharp declines clustered at ranks 7–9, which implies pressure building below the leading tier. With all ten top products in the Pre-Roll category and the highest rank positions anchored at 1, 2, and 3, the concentration signals a portfolio leaning on a single format while exposure to -45% magnitude drops suggests vulnerability to flavor-cycle swings more than price compression. Overall, this mix implies Michigander Fire is prioritizing depth within Pre-Rolls over breadth, and the pattern points to a need for faster SKU pruning and rotation to stabilize mid-tier ranks and protect the $20,696 flagship’s lead.
Top Selling Cannabis Brands
Data for this report comes from real-time sales reporting by participating cannabis retailers via their point-of-sale systems, which are linked up with Headset’s business intelligence software. Headset’s data is very reliable, as it comes digitally direct from our partner retailers. However, the potential does exist for misreporting in the instance of duplicates, incorrectly classified products, inaccurate entry of products into point-of-sale systems, or even simple human error at the point of purchase. Thus, there is a slight margin of error to consider. Brands listed on this page are ranked in the top twenty within the market and product category by total retail sales volume.

