May-2026
Sales
Trend
6-Month
Product Count
SKUs
Avg Price
YoY Sales Change
YoY Price Change
Market Insights Snapshot
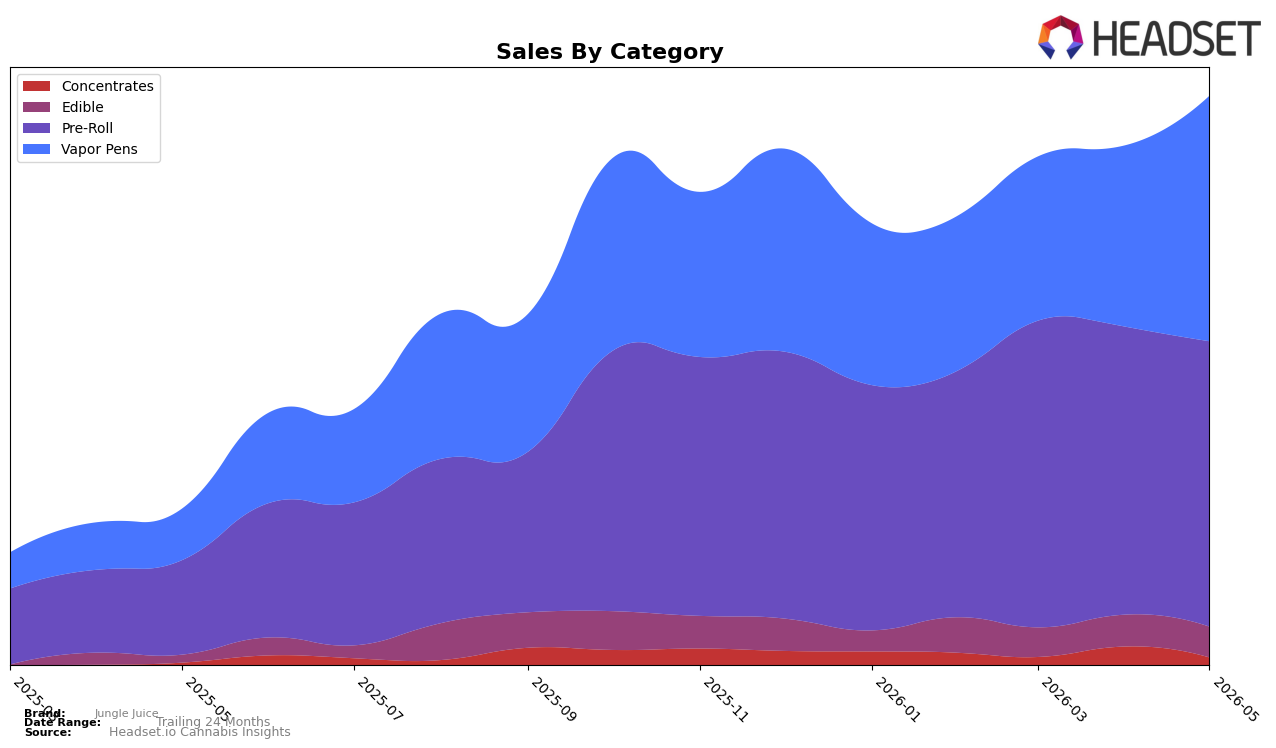
Jungle Juice concentrated nearly half of May 2026 sales in Pre-Roll at 49.65% share with a year-over-year rise of 196.96% but a month-over-month dip of 0.91%, while Vapor Pens climbed to 42.78% share on 359.13% year-over-year growth and a 34.96% month-over-month increase. Edible held 5.75% share with 216.90% year-over-year growth but slipped 3.12% month-over-month, and Concentrates narrowed to 1.81% share with 98.13% year-over-year growth but a sharp 51.03% month-over-month decline. The combined mix indicates a pivot toward inhalables, as Vapor Pens closed the gap to Pre-Roll by 6.87 percentage points month-over-month despite Pre-Roll’s category lead and an average price of $6.19 versus $11.44 in Vapor Pens, implying a volume-led core in Pre-Roll and a value-accretive growth lane in Vapor Pens.
Positionally, Jungle Juice sits as a price-flex brand with a 27.46% year-over-year drop in average price and a 247.60% brand-level sales surge, suggesting elasticity-fueled share capture anchored in Pre-Roll but with momentum shifting to Vapor Pens. With Pre-Roll ranked 11 in Michigan and Vapor Pens up 34.96% month-over-month, the near-term path to higher rank likely comes from Vapor Pens mix expansion rather than incremental Pre-Roll depth; the 51.03% month-over-month retreat in Concentrates and the 3.12% Edible pullback reinforce a two-category focus where sustaining Pre-Roll’s 49.65% share while letting Vapor Pens lift toward or above 45% share would tilt the portfolio toward higher ticket without sacrificing unit velocity. The implication is a deliberate trade-up strategy in inhalables, using Pre-Roll for traffic and Vapor Pens for margin, with May 2026 trends validating reallocation toward SKUs that convert at higher prices while maintaining rank progress in Pre-Roll.
Competitive Landscape
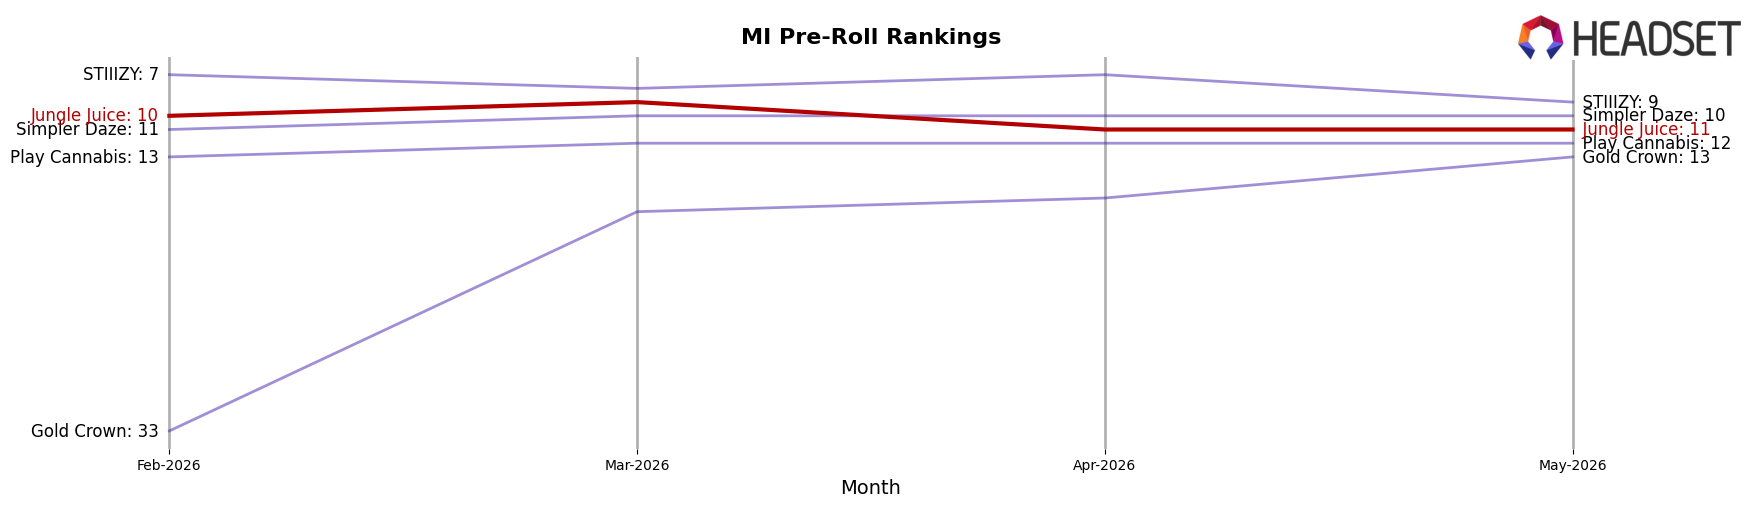
Jungle Juice sits at rank #11 in MI Pre-Roll for May 2026, a 15-place YoY climb from #26, yet it slipped 1 spot from #10 three months ago and remains 3 positions below its peak of #8 from December 2025; meanwhile, Jeeter held #1 YoY and current despite a 26.4% YoY sales decline, and Mitten Extracts advanced from #5 YoY to #4 with 35.3% YoY sales growth, indicating Jungle Juice’s rank gains are outpacing category leaders’ mixed momentum but recent month-to-month softness suggests a plateau risk without renewed share capture.
Notable Products
Gorilla Glue Pre-Roll (1g) posted the steepest decline in May 2026 at -18.2% MoM while holding rank 2, and Runtz Pre-Roll (1g) slipped -9.8% MoM at rank 4, indicating top-tier positions masking contraction. Gelato Pre-Roll (1g) remained rank 1 despite a -43.7% MoM drop, whereas White Widow Pre-Roll (1g) inched up +2.3% MoM at rank 3, creating a bifurcation between a shrinking leader and a stabilizing mid-top SKU. Eight of the top ten are Pre-Roll SKUs, and Tropicana Pre-Roll (1g) and Mimosa Pre-Roll (1g) both crossed the -10% MoM threshold at ranks 5 and 8, while Wedding Cake Pre-Roll (1g) sat just over -10% at rank 9, signaling category-level pressure rather than isolated product issues. Strawberry Cough Distillate Cartridge (1g) entered the top ten at rank 10 with $36,439 and no comparable MoM history, implying Jungle Juice is leaning on entrenched Pre-Roll breadth while probing Vapor Pens for diversification as Pre-Roll momentum cools.
Top Selling Cannabis Brands
Data for this report comes from real-time sales reporting by participating cannabis retailers via their point-of-sale systems, which are linked up with Headset’s business intelligence software. Headset’s data is very reliable, as it comes digitally direct from our partner retailers. However, the potential does exist for misreporting in the instance of duplicates, incorrectly classified products, inaccurate entry of products into point-of-sale systems, or even simple human error at the point of purchase. Thus, there is a slight margin of error to consider. Brands listed on this page are ranked in the top twenty within the market and product category by total retail sales volume.

