.svg)


Where to Buy
Momo is stocked at 27 licensed dispensaries across Washington and Alaska, 24 of them in Washington, with the deepest coverage in Tacoma, Everett, Seattle, Spokane, and Bothell. Search by ZIP code or city below to find the closest one.
Market Insights Snapshot
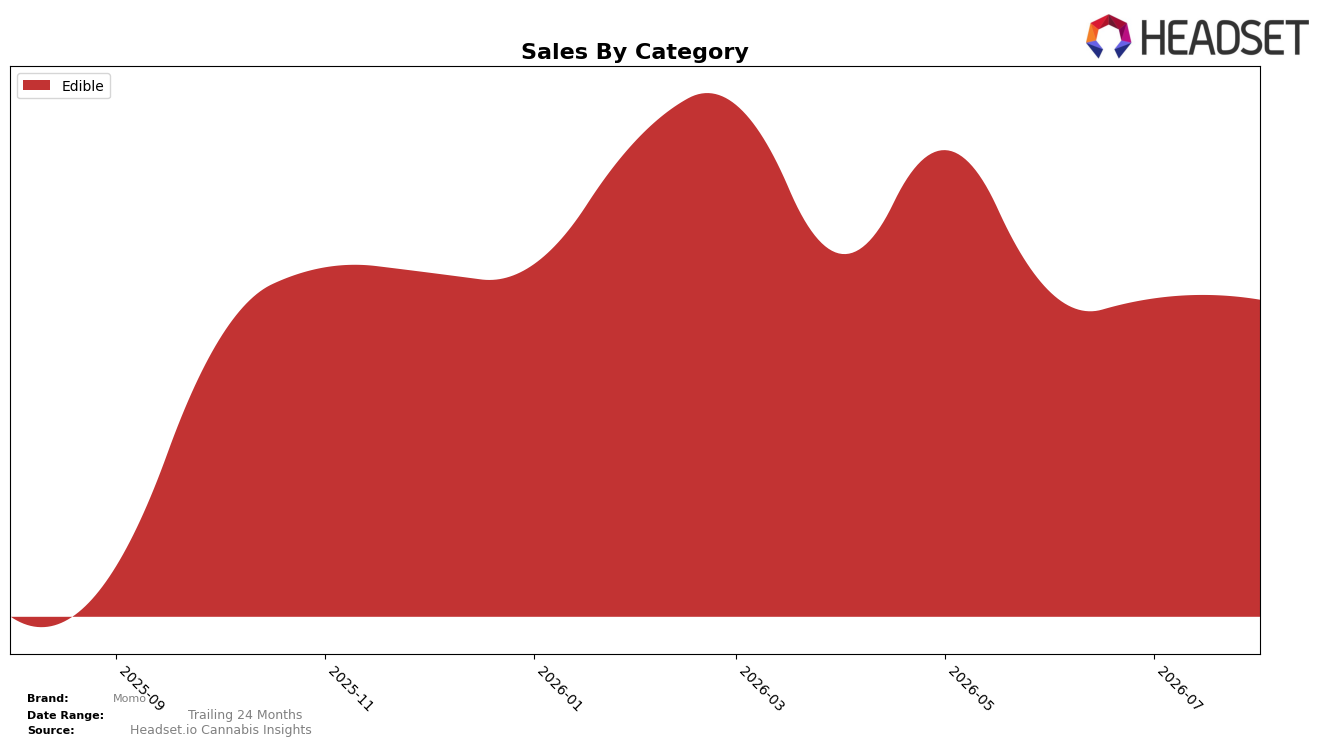
In August 2026, Momo operated as a single-category brand with Edible accounting for 100.0% of sales, a concentrated mix that coincided with a 2,342.1% year-over-year surge and a 0.4% month-over-month dip. Average price declined 17.5% YoY to $11.94 while category sales were flat MoM, indicating volume-led YoY expansion alongside a slight sequential softening. The concentration in Edible and the split between triple-digit YoY growth versus a fractional MoM contraction imply a rapid scaling phase that may be encountering short-cycle demand normalization, suggesting pricing elasticity is supporting share accumulation within a narrow product scope.
The combination of a 100.0% Edible mix and a 17.5% YoY price reduction positions Momo as a value-forward Edible specialist in Washington, leveraging price to catalyze unit growth while accepting thinner per-unit contribution. The 2,342.1% YoY lift alongside a 0.4% MoM decline implies the brand’s current edge is acquisition-driven rather than retention-driven, with sensitivity to immediate shelf dynamics and promotional cadence. This pattern suggests the next positioning move is to translate discount-enabled trial into repeat through SKU depth and format differentiation, or risk plateauing as the short-term pricing tailwind fades.
Competitive Landscape
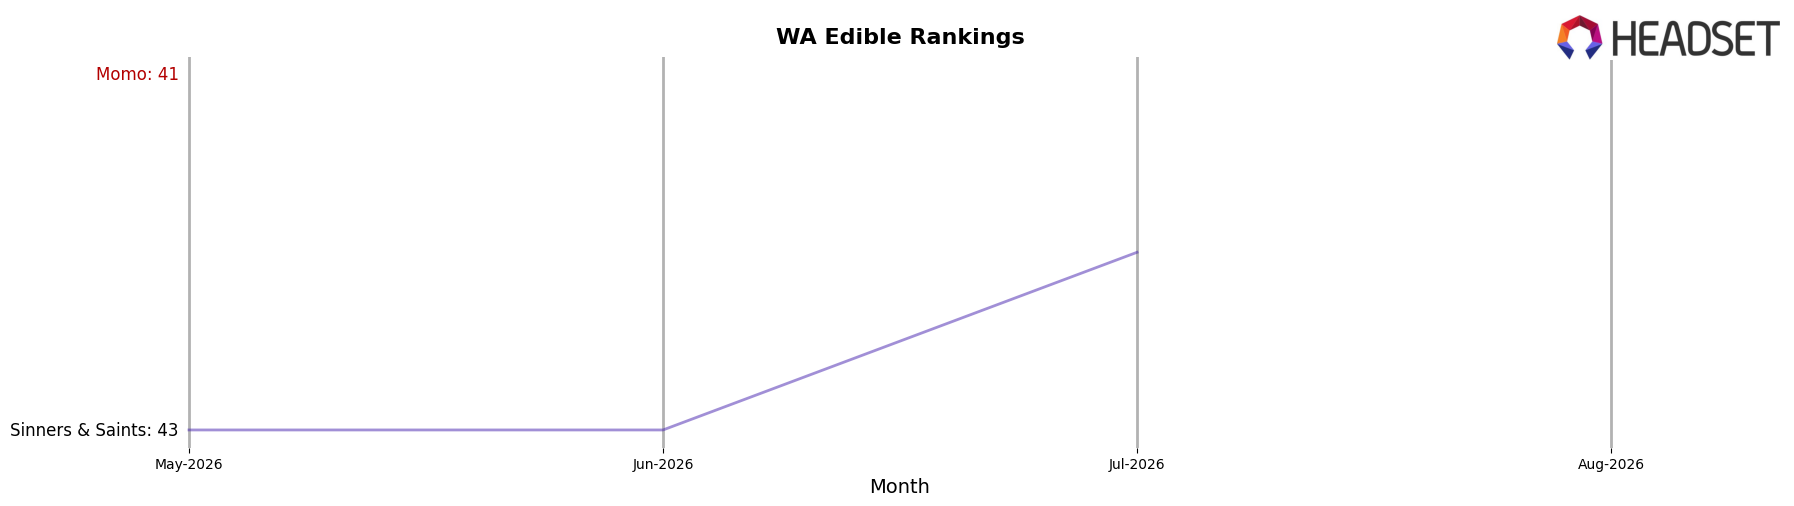
Momo sits at rank #43 in WA Edible in August 2026, improving 38 positions from #81 year over year, yet slipping 2 spots from its three-month peak at #41 reached in May 2026; meanwhile, Wyld holds #1 with a 5.1% YoY sales lift, and Craft Elixirs remains #5 with a 13.9% YoY decline, indicating Momo’s mid-pack ascent is occurring while the top tier is stable and parts of the upper ranks contract. The current #43 position versus #41 three months ago suggests recent momentum has cooled, and the 38-rank YoY climb paired with a flat top-5 leaderboard (ranks #1–#5 unchanged year over year) implies Momo’s path to further gains will rely on displacing mid-tier brands rather than expecting churn at the very top.
Notable Products
Pineapple Burst Gummies 10-Pack (100mg) led the story for August 2026 with a -12.7% month-over-month slide and a hold at rank 1, while Strawberry Sunset Live Resin Gummies 10-Pack (100mg) fell -18.9% at rank 6, signaling pressure at the top and mid-tier. In contrast, Raspberry Island Gummies 10-Pack (100mg) climbed +25.4% to rank 4 and CBN/THC 1:1 Strawberry Sunset Live Resin Gummies 10-Pack (100mg CBN, 100mg THC) advanced +23.2% at rank 7, pointing to momentum in flavor variants and minor-cannabinoid formats. Eight of the top ten SKUs are Edibles, with Live Resin variants mixed in as climbers while CBD-forward products like CBD/THC 1:1 Raspberry Island Gummies 10-Pack (100mg CBD, 100mg THC) declined -14.1% at rank 5, indicating a shift toward THC-dominant and experiential formulations over wellness-leaning profiles. The pattern implies Momo is tilting its product mix toward higher-THC and live-resin experiences where velocity concentrates in ranks 1–4 despite volatility, suggesting resource allocation should favor these formulations over softening CBD-led lines.
Top Selling Cannabis Brands






Data for this report comes from real-time sales reporting by participating cannabis retailers via their point-of-sale systems, which are linked up with Headset’s business intelligence software. Headset’s data is very reliable, as it comes digitally direct from our partner retailers. However, the potential does exist for misreporting in the instance of duplicates, incorrectly classified products, inaccurate entry of products into point-of-sale systems, or even simple human error at the point of purchase. Thus, there is a slight margin of error to consider. Brands listed on this page are ranked in the top twenty within the market and product category by total retail sales volume.

