May-2026
Sales
Trend
6-Month
Product Count
SKUs
Avg Price
YoY Sales Change
YoY Price Change
Market Insights Snapshot
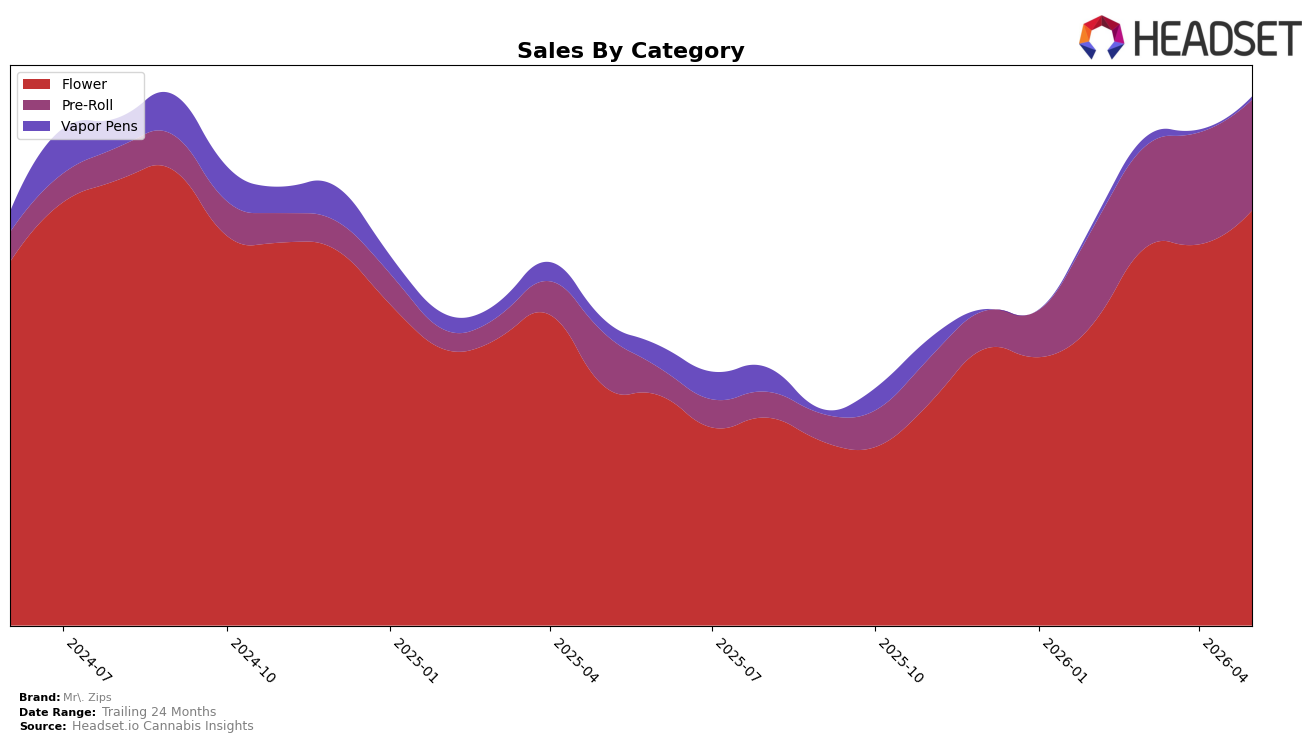
In May 2026, Mr. Zips concentrated 77.64% of sales in Flower with year-over-year growth of 72.06% and month-over-month growth of 8.83%, while Pre-Roll held 21.14% share with 102.03% year-over-year growth but slipped 1.03% month over month; Vapor Pens contributed 1.22% share with a 60.73% year-over-year decline yet a 6.77% month-over-month uptick. The average price fell 22.56% year over year to $15.56, with category-level price points diverging (Flower at $20.92 and Pre-Roll at $7.97), and Flower rank in California sits at 26; taken together, the mix suggests volume-led expansion anchored in Flower while Pre-Roll volatility and Vapor Pens contraction cap diversification.
The mix shift implies Mr. Zips is consolidating positioning as a Flower-first brand in California, where a 26 rank aligns with scale but leaves differentiation headroom; the 8.83% month-over-month Flower gain alongside a 1.03% month-over-month Pre-Roll dip indicates merchandising and pricing are pulling demand toward core Flower instead of extending cross-category breadth. With brand sales up 70.39% year over year and Vapor Pens down 60.73% year over year despite a 6.77% month-over-month lift, the path forward tilts toward defending Flower share while selectively testing Pre-Roll to manage price architecture rather than rebuilding Vapor Pens, implying near-term positioning around accessible Flower price tiers that trade up basket size without overextending assortment.
Competitive Landscape
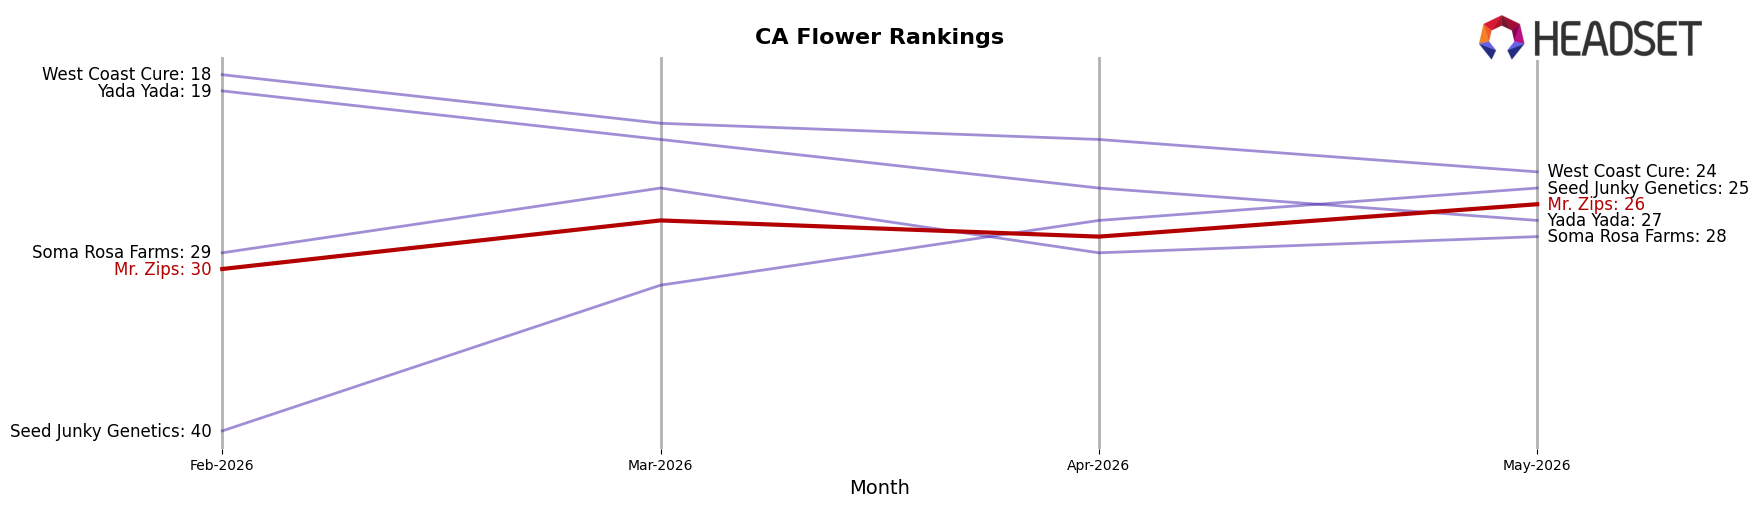
Mr. Zips sits at rank 26 in CA Flower for May 2026, improving 30 positions year over year from rank 56, and edging up 4 spots since February 2026 from rank 30, while still one place off its peak rank of 25 from September 2024; against this backdrop, CAM climbed from rank 4 to rank 1 with a 46.88% YoY sales increase and STIIIZY held near the top at rank 2 with 39.68% YoY growth, whereas CannaBiotix (CBX) slipped from rank 1 to rank 3 on an 8.31% YoY sales decline; the pattern implies Mr. Zips is moving from mid-pack toward the top tier but must convert rank momentum into sustained share gains to keep pace with leaders expanding sales by roughly 40–47%.
Notable Products
Elektra Ice (7g) led May 2026 with a +20.3% month-over-month lift into rank 9, while Elektra Ice (3.5g) in rank 8 rose a smaller +4.5%, indicating momentum skewed toward larger pack sizes rather than across the whole line. Three of the top four ranks are Pre-Roll SKUs, and OG Cherry Pre-Roll (1g) sits at rank 1 while Golden Gas Pre-Roll (1g) holds rank 2, suggesting the pre-roll cluster is anchoring visibility even as Flower carries more absolute dollars, with Sunshine Punch 7g) contributing $36,398. The pattern implies Mr. Zips is tilting toward higher-quantity Flower formats for volume growth while maintaining traffic through a dense pre-roll presence at the very top of the rankings.
Top Selling Cannabis Brands
Data for this report comes from real-time sales reporting by participating cannabis retailers via their point-of-sale systems, which are linked up with Headset’s business intelligence software. Headset’s data is very reliable, as it comes digitally direct from our partner retailers. However, the potential does exist for misreporting in the instance of duplicates, incorrectly classified products, inaccurate entry of products into point-of-sale systems, or even simple human error at the point of purchase. Thus, there is a slight margin of error to consider. Brands listed on this page are ranked in the top twenty within the market and product category by total retail sales volume.

