.svg)

Aug-2026
Sales
Trend
6-Month
Product Count
SKUs
Avg Price
YoY Sales Change
YoY Price Change


Where to Buy
West Coast Treez is stocked at 153 licensed dispensaries across California, with the deepest coverage in San Francisco, Los Angeles, Sacramento, San Diego, and Long Beach. Search by ZIP code or city below to find the closest one, or filter by product type if you are after a specific format.
Market Insights Snapshot
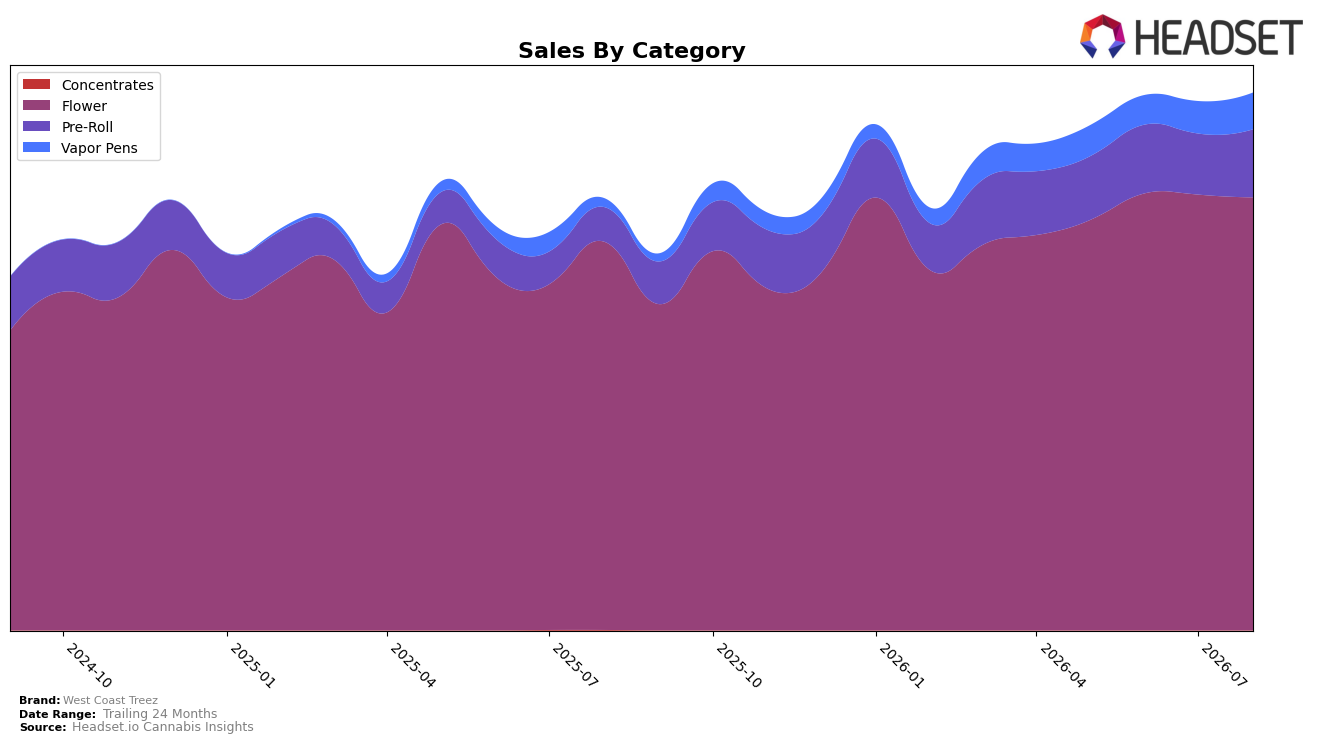
West Coast Treez concentrated 80.59% of August 2026 sales in Flower, where year-over-year growth was 11.53% but month-over-month slipped 0.64%, while Pre-Roll rose to 12.62% share with 97.97% YoY and 11.73% MoM growth. Vapor Pens expanded to 6.79% share on 324.02% YoY and 13.53% MoM, yet the brand’s average price fell 15.92% YoY as overall brand sales increased 24.52% YoY, pointing to mix-led volume gains offsetting price compression. The pattern implies a deliberate tilt toward lower-priced formats that scale units — Pre-Roll and Vapor Pens — while Flower remains the anchor but is no longer the only growth engine.
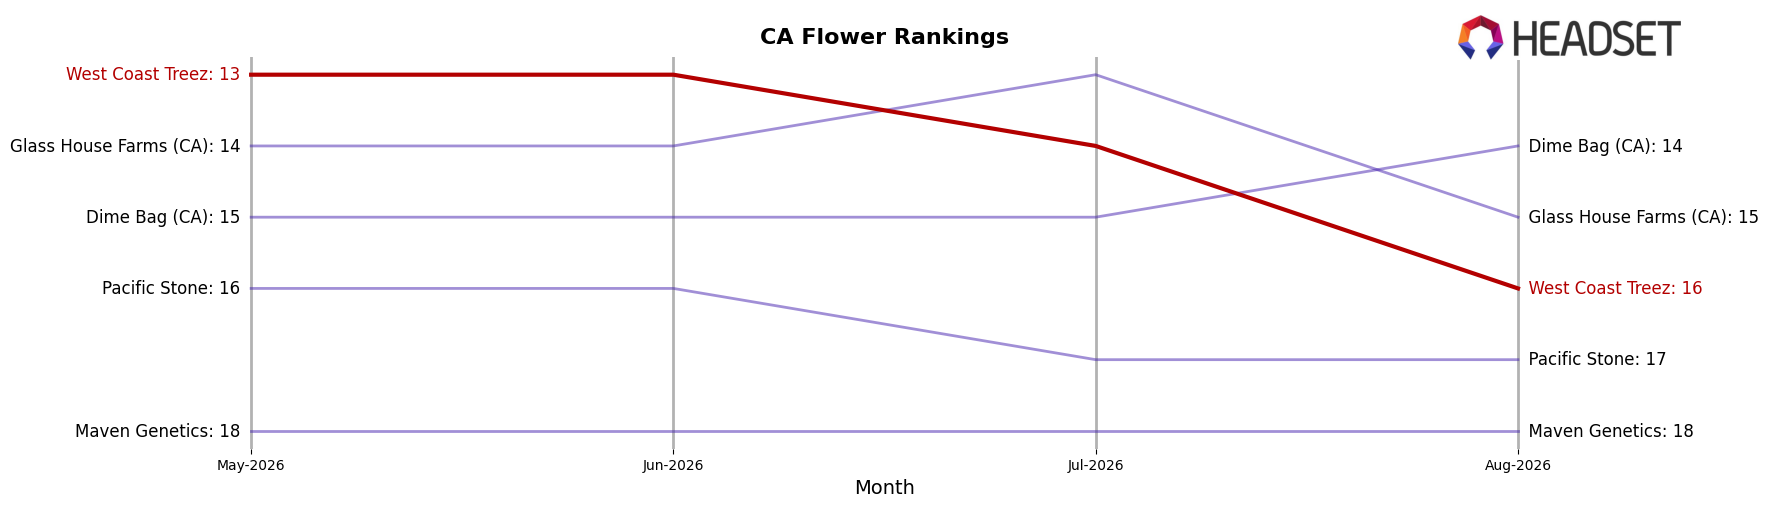
In California Flower, West Coast Treez sits at rank 16, with Flower’s share at 80.59% and MoM at -0.64% against Pre-Roll’s 11.73% MoM and Vapor Pens’ 13.53% MoM, indicating that momentum is accruing in ancillary formats rather than the core. With Vapor Pens posting 324.02% YoY and Pre-Roll 97.97% YoY versus Flower’s 11.53% YoY, the brand is migrating toward faster-turn, accessible price points even as average price is down 15.92% YoY, implying a positioning shift toward value-led entry categories that can diversify reliance on Flower while defending shelf presence at rank 16.
Competitive Landscape
West Coast Treez sits at rank #16 in California Flower in August 2026, improving 2 positions from #18 year over year but slipping 3 spots from #13 in May–June 2026 to #16 by August 2026; meanwhile, STIIIZY advanced from #2 to #1 with 50.99% YoY sales growth and Oakfruitland surged from #14 to #5 with 80.47% YoY growth, outpacing brands that fell such as CannaBiotix (CBX) sliding from #1 to #3 alongside a -15.42% YoY decline; this mix of a 2-rank YoY gain but a 3-rank slip since June 2026 implies West Coast Treez is stabilizing year over year yet ceding momentum quarter-over-quarter to faster risers.
Notable Products
MAC Pre-Roll (1g) posted the standout move in August 2026 with a 158% month-over-month surge to rank 2, while Blue Gelato Pre-Roll (1g) held rank 1 despite a 5.7% dip. Tahoe Vibes Pre-Roll (1g) fell 17.7% at rank 7, and Sherbhead (3.5g) declined 36.8% at rank 9, marking the steepest retreat among top-10 SKUs. Eight of the top ten are Pre-Rolls, concentrating share around format-led demand, and the single largest Flower item, Lemon Gas Smalls (3.5g), entered at rank 10 with $33,057, signaling a secondary role for Flower versus surging Pre-Rolls. The pattern implies West Coast Treez is consolidating around high-velocity Pre-Rolls while permitting Flower to play a supporting role rather than the growth engine.
Top Selling Cannabis Brands






Data for this report comes from real-time sales reporting by participating cannabis retailers via their point-of-sale systems, which are linked up with Headset’s business intelligence software. Headset’s data is very reliable, as it comes digitally direct from our partner retailers. However, the potential does exist for misreporting in the instance of duplicates, incorrectly classified products, inaccurate entry of products into point-of-sale systems, or even simple human error at the point of purchase. Thus, there is a slight margin of error to consider. Brands listed on this page are ranked in the top twenty within the market and product category by total retail sales volume.

