Market Insights Snapshot
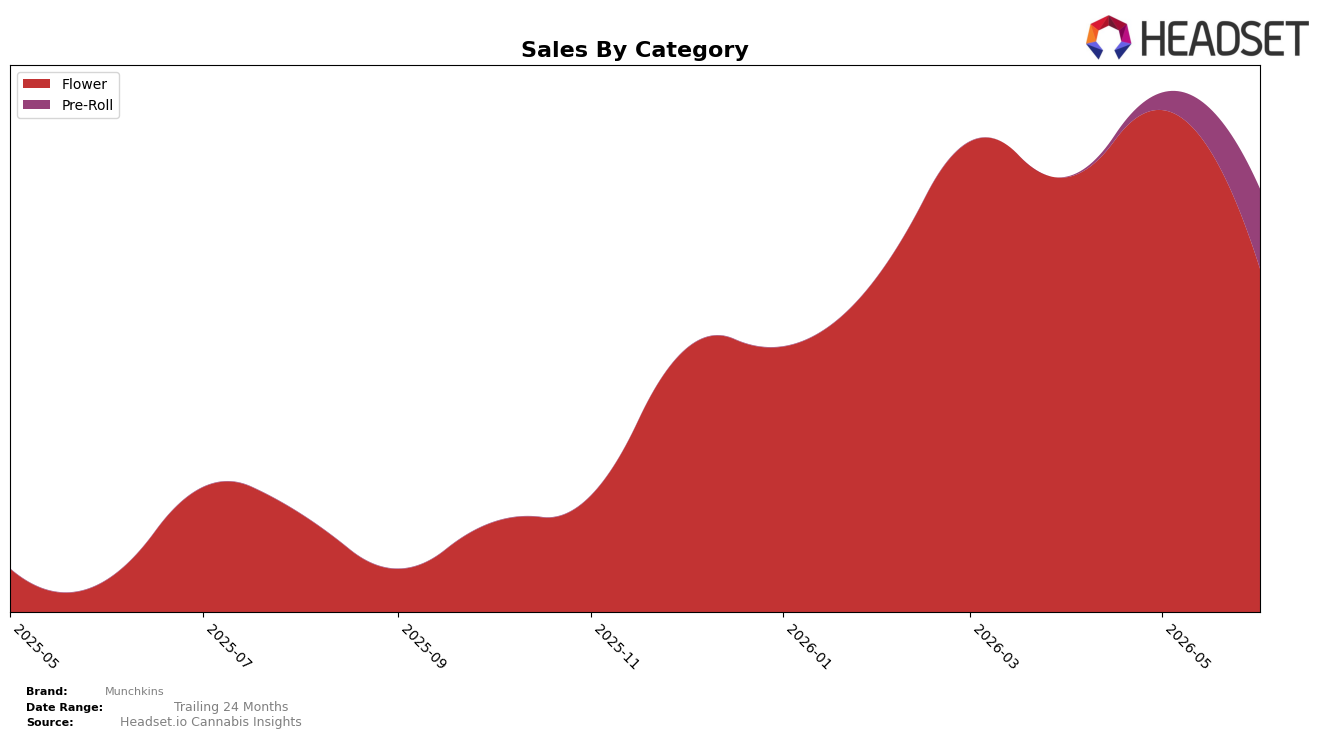
Munchkins concentrated 81.17% of June 2026 sales in Flower while Pre-Roll held 18.83%, indicating a two-category portfolio with sharply different trajectories. Flower expanded 961.02% year over year but contracted 31.63% month over month, whereas Pre-Roll lacks a year-over-year baseline yet surged 364.68% month over month; combined with a 54.17% year-over-year drop in average price to $49.75, this mix points to trading down in Flower and trial-driven momentum in Pre-Roll. In New York Flower, the brand sat at rank 30 while its top category share was 81.17%, implying that growth is concentrated but still mid-pack within the state category.
The pivot implied by a 31.63% month-over-month decline in Flower alongside a 364.68% month-over-month spike in Pre-Roll suggests short-term substitution rather than additive growth, especially with a 54.17% year-over-year price compression coinciding with a 961.02% year-over-year Flower expansion. Holding rank 30 in New York Flower while Pre-Roll gains mix share to 18.83% implies the brand’s near-term positioning is shifting toward value-accessible formats for acquisition while maintaining scale in Flower, a pattern that sets expectations for further mix diversification if Pre-Roll maintains double- or triple-digit monthly momentum.
Competitive Landscape
Munchkins sits at #30 in June 2026, climbing 100 spots from #130 year over year, but slipping 8 positions from its three-month peak of #22 in May 2026; the 36% month-over-month rank drop from #22 to #30 contrasts with a 77% faster year-over-year climb than the average top-10 stability implied by Find. moving from #3 to #1 and RYTHM advancing from #10 to #5. While Leal rose from #7 to #2 with 44.4% year-over-year sales growth and Dank. By Definition fell from #1 to #3 alongside a 50.7% sales decline, Munchkins’ rise from #130 to #30 coupled with a one-month pullback from #22 implies momentum that is not yet locked into the upper tier and suggests volatility tied to recent share gains rather than entrenched placement.

Notable Products
Cookies and Cream Smalls (28g) posted the steepest decline at -60.4% month over month and slid to rank 10, while Trop Cherry Smalls (28g) fell -46.4% to rank 9, indicating accelerated pullback in value-pack Flower formats. At the top, Blue Haze Smalls (28g) holds rank 1 with no reported month-over-month figure and Blueberry Fritter Smalls (28g) sits at rank 6 with $54,957, but Maui Wowie (3.5g) dropped -26.1% at rank 2 as Maui Wowie Smalls (28g) also fell -24.3% at rank 8, pointing to brand-wide softness within the Maui Wowie lineage. Three of the top five are Flower 3.5g SKUs, yet smalls occupy six of the top ten ranks, and Cookies and Cream (3.5g) declined -44.8% at rank 4 while Trop Cherry (3.5g) inched up +2.3% at rank 3, suggesting premium eighths are bifurcating between stabilization and retreat as bulk sizes reset. The pattern implies Munchkins is over-indexed to Flower with a growing reliance on smalls that is now correcting, signaling a need to rebalance toward differentiated eighths while pruning lagging smalls SKUs.
Top Selling Cannabis Brands
Data for this report comes from real-time sales reporting by participating cannabis retailers via their point-of-sale systems, which are linked up with Headset’s business intelligence software. Headset’s data is very reliable, as it comes digitally direct from our partner retailers. However, the potential does exist for misreporting in the instance of duplicates, incorrectly classified products, inaccurate entry of products into point-of-sale systems, or even simple human error at the point of purchase. Thus, there is a slight margin of error to consider. Brands listed on this page are ranked in the top twenty within the market and product category by total retail sales volume.

