May-2026
Sales
Trend
6-Month
Product Count
SKUs
Avg Price
YoY Sales Change
YoY Price Change
Market Insights Snapshot
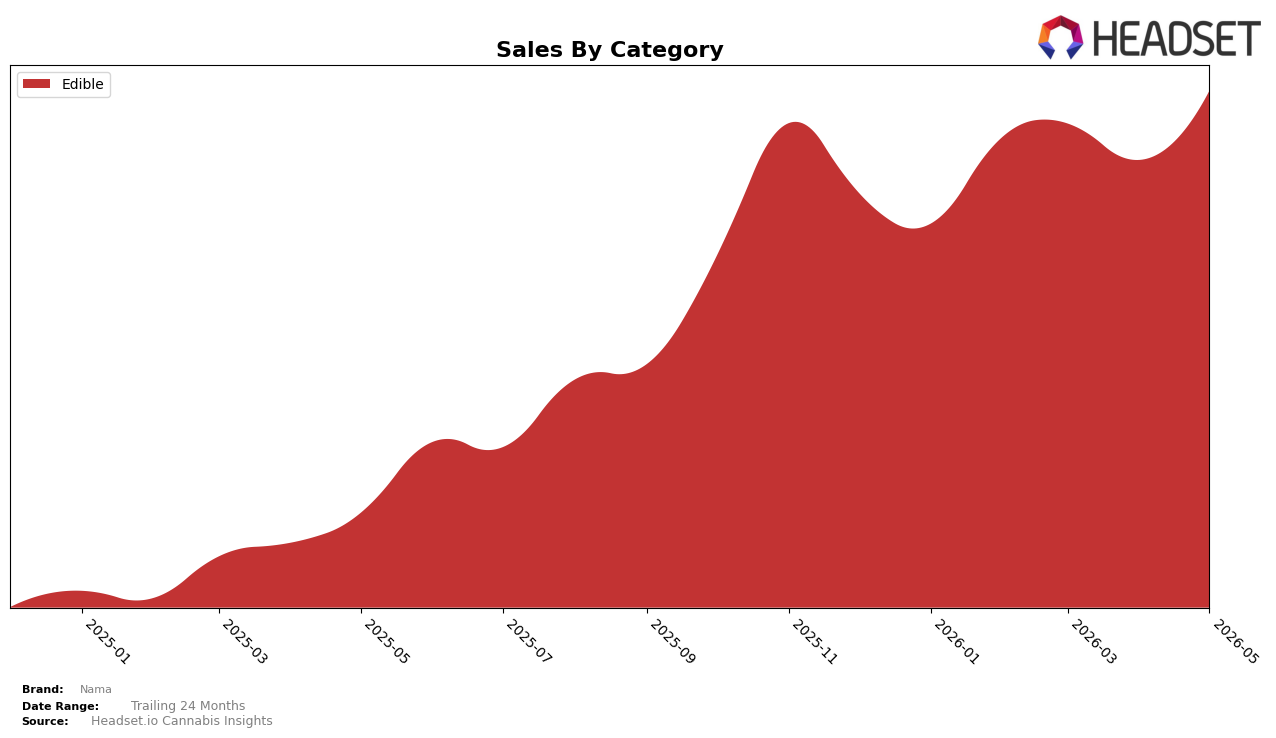
In May 2026, Nama operated as a single-category brand with Edible at 100.0% mix, posting 352.42% year-over-year sales growth and a 14.65% month-over-month lift, while average price rose 5.90% YoY to $15.04. Within the Edible focus, the brand’s rank sat at 29 in Edible in New Jersey, indicating that despite triple-digit YoY growth and a double-digit MoM gain, scale is concentrated in one format and rank improvement will hinge on depth within that category rather than diversification.
The combination of a 100.0% category mix in Edible and a 5.90% YoY price increase alongside 14.65% MoM sales growth points to demand elasticity that currently tolerates modest pricing, suggesting headroom for targeted premium SKUs without immediate cross-category risk. With a rank of 29 in Edible in New Jersey and 352.42% YoY sales growth concentrated entirely in one category, Nama’s positioning implies a specialization strategy where incremental share gains are more likely from assortment breadth and velocity inside Edible than from entering adjacent categories.
Competitive Landscape
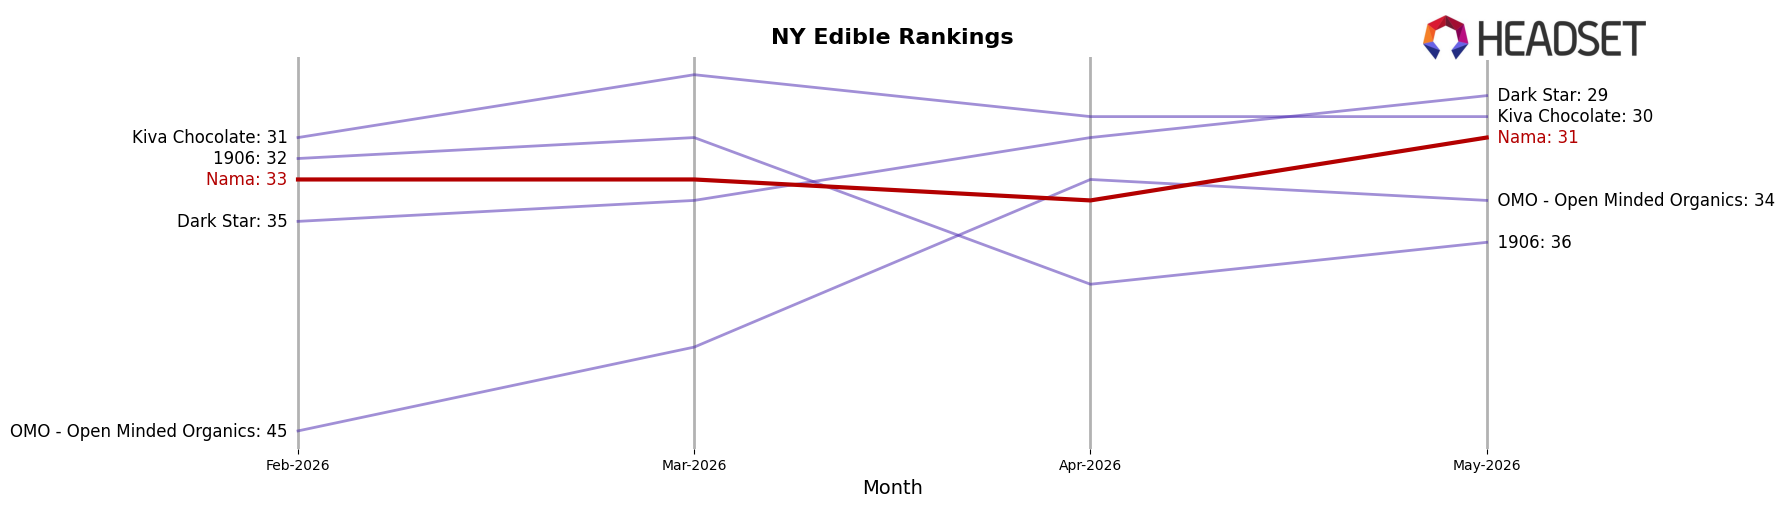
Nama ranks #31 in NY Edible for May 2026, improving 14 positions year over year from #45 while sitting 2 spots above its February 2026 level of #33; despite peaking at #30 in November 2025, it has not broken into the top 30 this month. Competitive movement is tightening at the top: Off Hours slipped from #1 to #2 as of May 2026 while growing sales year over year by 6.84%, whereas Wyld held steady at #3 with a 25.04% sales lift; this contrast suggests Nama’s rank gain is outpacing some incumbents’ positional stability but not their velocity. With Gron / Grön static at #4 alongside a 30.22% sales increase and the category leader Camino edging from #2 to #1 on 15.89% YoY growth, Nama’s +14-rank YoY climb combined with a one-rank fall from its November 2025 peak implies momentum that is incremental rather than breakout, positioning it for share consolidation just outside the top 30 unless it converts rank gains into sustained top-tier displacement.
Notable Products
Euphoria - Sour Berry RSO Gummies 2-Pack (100mg) delivered the headline move in May 2026 with a 71% month-over-month increase and a jump to rank 1, while Euphoria - Super Lemon Haze x Blood Orange Live Resin Gummies 2-Pack (100mg) slipped 16% MoM at rank 8. Euphoria - Fresh Strawberry RSO Gummies 2-Pack (100mg) also crossed the +50% threshold at +51% MoM and held rank 2, and Euphoria - Sour Diesel x Pear Live Resin Gummies 2-Pack (100mg) grew 12% MoM at rank 3. With eight of the top ten being RSO or Live Resin Edible SKUs and the top two both RSO variants, the mix points to intensified consumer pull toward high-potency, effect-forward gummies, suggesting Nama is consolidating leadership around Euphoria-branded RSO formats.
Top Selling Cannabis Brands
Data for this report comes from real-time sales reporting by participating cannabis retailers via their point-of-sale systems, which are linked up with Headset’s business intelligence software. Headset’s data is very reliable, as it comes digitally direct from our partner retailers. However, the potential does exist for misreporting in the instance of duplicates, incorrectly classified products, inaccurate entry of products into point-of-sale systems, or even simple human error at the point of purchase. Thus, there is a slight margin of error to consider. Brands listed on this page are ranked in the top twenty within the market and product category by total retail sales volume.

