Market Insights Snapshot
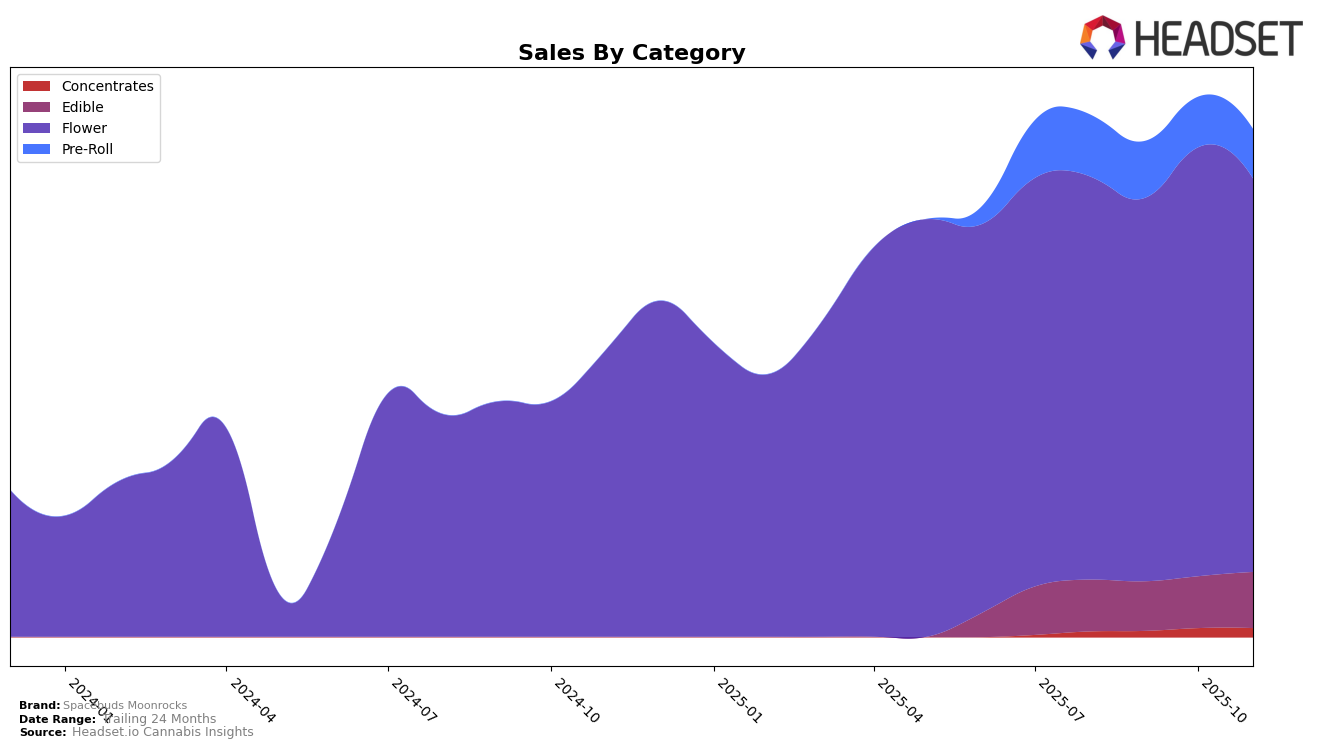
Spacebuds Moonrocks has shown varied performance across different categories in New York. In the Edible category, the brand has struggled to break into the top 30, maintaining a position just outside it at 34th and 32nd in August and September, respectively, before settling at 35th in October and November. This indicates a consistent demand, albeit not strong enough to elevate the brand into the more competitive ranks. On the other hand, their performance in the Flower category has been more promising. Starting at 29th in August, Spacebuds Moonrocks improved to 26th in October, though it saw a slight dip back to 29th in November. This fluctuation suggests some volatility in consumer preference or competition, but the brand remains a notable player in this category.
In contrast, Spacebuds Moonrocks' presence in the Pre-Roll category is less prominent, as indicated by its ranking outside the top 30 throughout the observed months. Despite this, there was an improvement from 93rd in August to 87th in November, hinting at a slow but positive trend in consumer interest. Such movements, while not dramatic, could signal potential for growth if the brand can capitalize on consumer preferences or market gaps. Overall, while Spacebuds Moonrocks has not yet dominated any particular category in New York, its varied performance across categories suggests areas for strategic focus and potential growth in the future.
Competitive Landscape
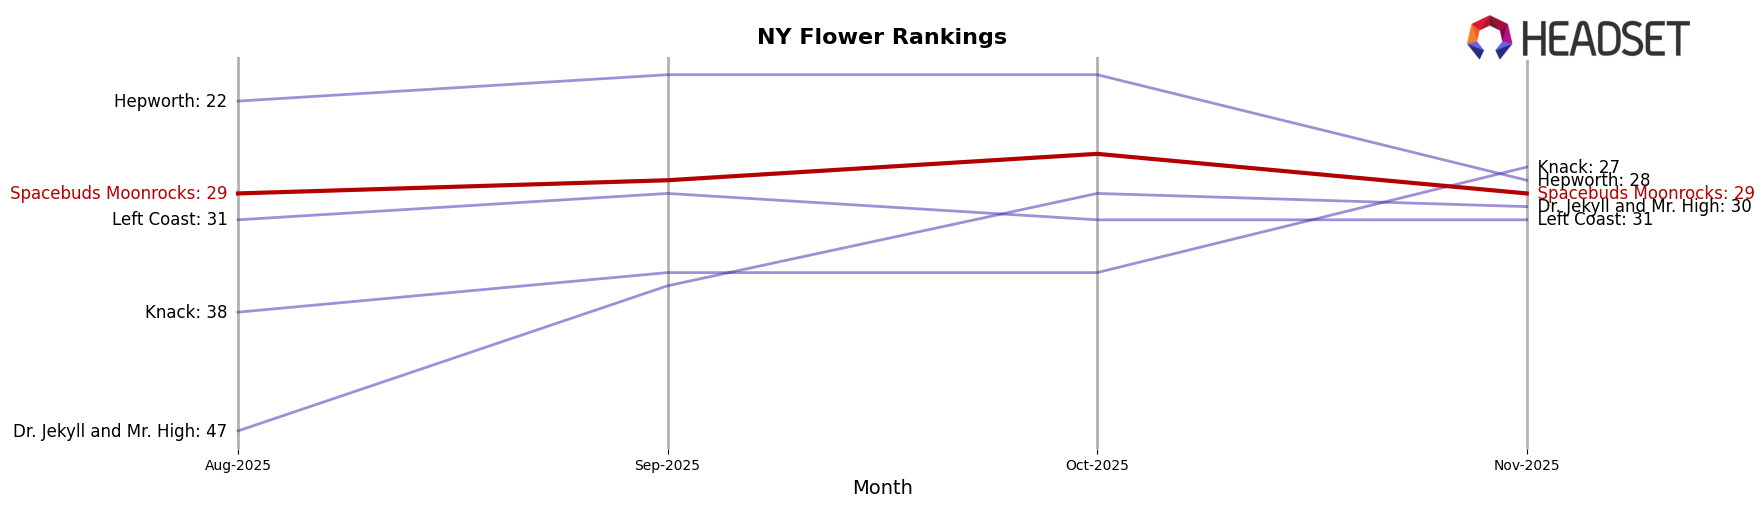
In the competitive landscape of the Flower category in New York, Spacebuds Moonrocks has demonstrated resilience and consistency in its market position. Over the past few months, Spacebuds Moonrocks has maintained a stable rank, fluctuating slightly from 29th in August 2025 to 26th in October 2025, before settling at 29th in November 2025. This stability is notable compared to competitors like Hepworth, which experienced a decline from 20th to 28th, and Knack, which improved from 35th to 27th in the same period. Although Dr. Jekyll and Mr. High showed a significant upward trend, moving from 47th to 30th, Spacebuds Moonrocks' consistent sales figures suggest a loyal customer base and effective market strategies. In contrast, Left Coast maintained a steady rank at 31st, indicating a stable but less dynamic presence. These insights highlight Spacebuds Moonrocks' ability to sustain its market position amidst fluctuating competitor performances, suggesting potential for strategic growth and increased market share.
Notable Products
In November 2025, the Blueberry Muffin Hash Moonrocks (4g) maintained its top spot as the leading product from Spacebuds Moonrocks, with a notable sales figure of 3703 units. The Strawberry Slushie Live Rosin Moon Bites Gummies 10-Pack (100mg) climbed to second place, showing an improvement from its consistent third-place rank in the previous months. The Blueberry Muffin Live Rosin Moon Bites Gummies 10-Pack (100mg) dropped to third place after holding the second position for two consecutive months. The Blueberry Muffin Infused Pre-Roll (1.5g) went up to fourth place, showing a steady rise from fifth place in October 2025. Meanwhile, the Pina Colada Moonrocks (4g) slipped to fifth place, continuing its decline from second place in August 2025.
Top Selling Cannabis Brands
Data for this report comes from real-time sales reporting by participating cannabis retailers via their point-of-sale systems, which are linked up with Headset’s business intelligence software. Headset’s data is very reliable, as it comes digitally direct from our partner retailers. However, the potential does exist for misreporting in the instance of duplicates, incorrectly classified products, inaccurate entry of products into point-of-sale systems, or even simple human error at the point of purchase. Thus, there is a slight margin of error to consider. Brands listed on this page are ranked in the top twenty within the market and product category by total retail sales volume.

