Market Insights Snapshot
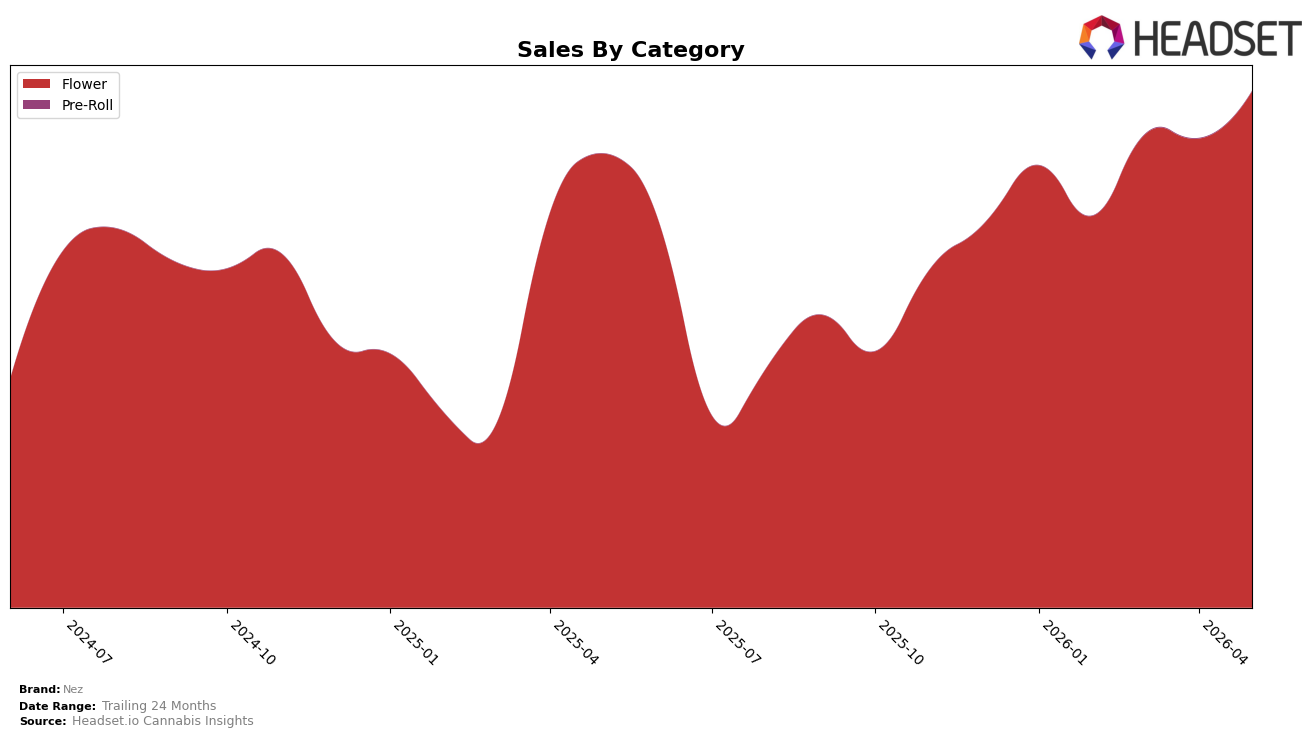
Nez concentrated 99.96% of May 2026 sales in Flower, with Pre-Roll at 0.04% share; within this mix, Flower grew 13.72% year over year and 10.08% month over month, while Pre-Roll declined 31.89% month over month and carried no year-over-year comp. Overall brand sales rose 13.77% year over year alongside a 2.81% decline in average price to $43.26, and Flower’s average price sat at $43.32, indicating volume-led gains; the category weighting remained heavily tilted to Flower despite Pre-Roll’s minor presence. This concentration, combined with positive Flower YoY and MoM momentum, implies Nez is leaning into a single-category scale play rather than diversifying mix for risk buffering.
Holding a Flower rank of 21 in Illinois while maintaining 99.96% category concentration suggests brand positioning centered on mid-pack Flower competitiveness rather than cross-category breadth, and the 10.08% MoM lift in Flower against a 31.89% MoM drop in Pre-Roll implies resource allocation and consumer pull are reinforcing that stance. With a 2.81% YoY price decrease coupled with 13.77% YoY sales growth, Nez is trading price for velocity in Flower, which implies a volume-acquisition strategy intended to climb share and rank within the state’s Flower set without near-term reliance on secondary categories.
Competitive Landscape
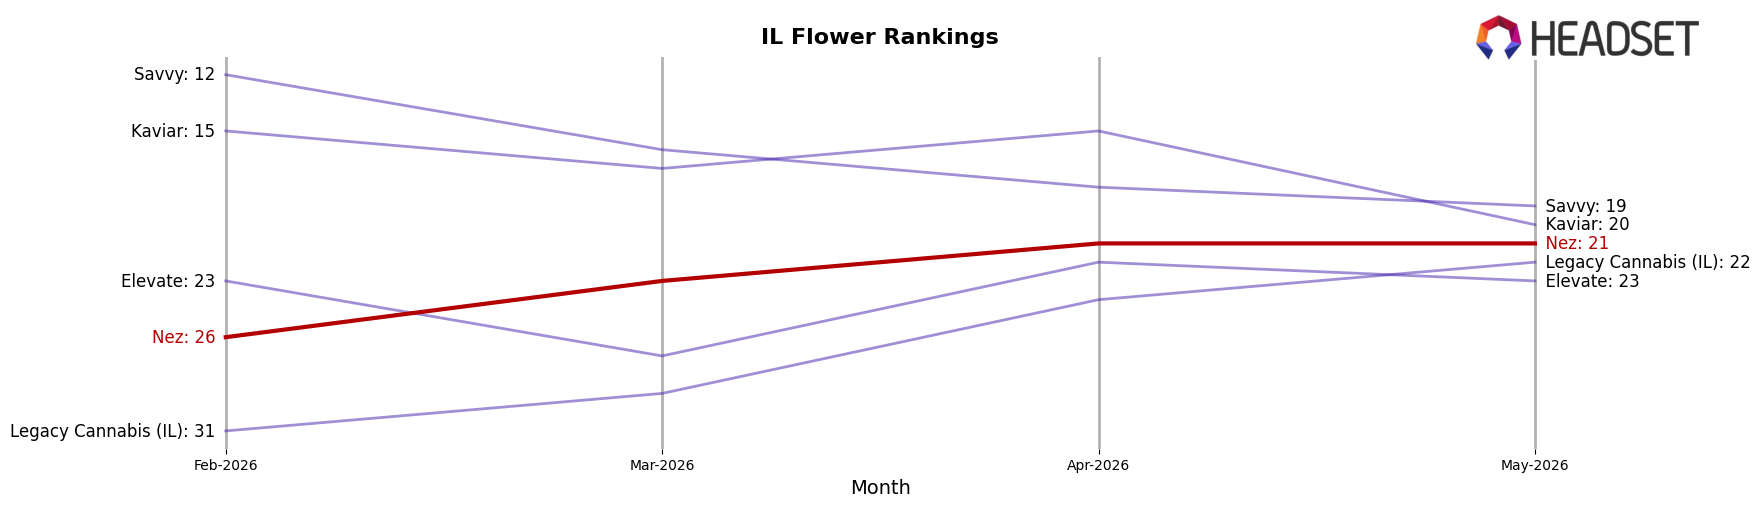
Nez sits at rank #21 in IL Flower in May 2026, improving 7 positions from #28 year over year and 5 positions from #26 in February 2026, while also matching its peak rank of #21 in May 2026; by comparison, High Supply / Supply held #1 both year over year and in May 2026 as its sales grew 29.8%, and RYTHM stayed at #2 year over year despite a 12.2% sales decline, indicating Nez is closing distance on mid-tier rivals but still trails top incumbents. The step-up from #28 to #21 alongside a 5-rank climb since February 2026 implies Nez’s trajectory is upward but requires sustained share gains to transition from the low-20s into the top-15 cohort.
Notable Products
Black Maple #22 (1g) posted the steepest movement in May 2026 with a -12.7% month-over-month decline while holding rank 6, contrasting with Strawberry Guava (1g) at rank 1 on +5.5% and Blueberry Sugar (1g) at rank 4 on +41.4%. White Rainbow spans three SKUs inside the top 10 at ranks 2, 5, and 8, concentrating share within one strain family, and the 7g format’s placement at rank 8 signals multi-size traction alongside a $35,689 haul. The spread between rank 1 and rank 6 alongside sub-10g and multi-pack formats indicates Nez is tilting toward a few hero strains with complementary pack sizes rather than broad SKU expansion.
Top Selling Cannabis Brands
Data for this report comes from real-time sales reporting by participating cannabis retailers via their point-of-sale systems, which are linked up with Headset’s business intelligence software. Headset’s data is very reliable, as it comes digitally direct from our partner retailers. However, the potential does exist for misreporting in the instance of duplicates, incorrectly classified products, inaccurate entry of products into point-of-sale systems, or even simple human error at the point of purchase. Thus, there is a slight margin of error to consider. Brands listed on this page are ranked in the top twenty within the market and product category by total retail sales volume.

