Feb-2026
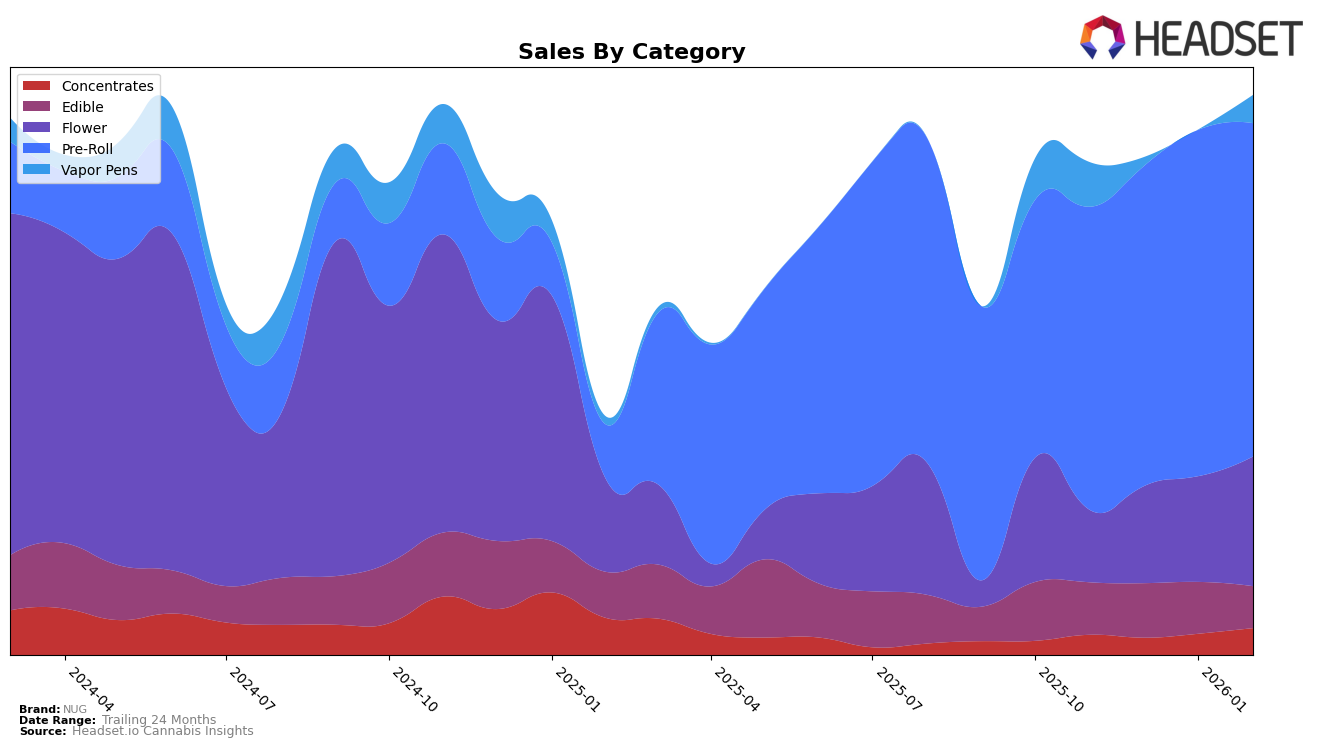
Sales
Trend
6-Month
Product Count
SKUs
Avg Price
YoY Sales Change
YoY Price Change
Market Insights Snapshot
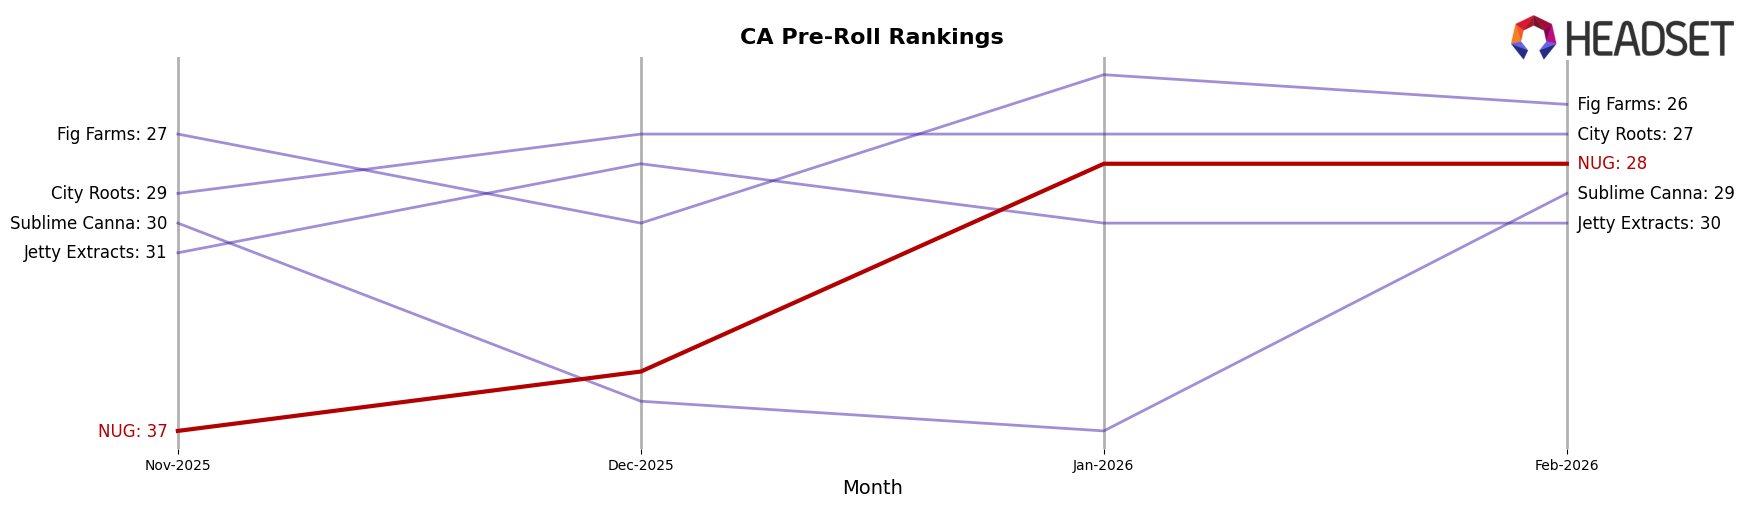
In California, NUG's performance across various categories has shown mixed results. Notably, in the Pre-Roll category, NUG made significant strides, climbing from the 37th position in November 2025 to the 28th position by January 2026, maintaining this rank in February. This upward movement suggests a strengthening presence in the Pre-Roll market. However, the brand's performance in the Edible category remained relatively stable, holding the 38th position from November 2025 to January 2026, before dropping slightly to 39th in February. Such stability in rankings indicates a consistent market presence, though the slight dip in February could signal increasing competition or changing consumer preferences.
In Oregon, NUG's performance in the Concentrates category has been somewhat volatile. The brand was ranked 70th in November 2025, but its absence from the top 30 in December indicates a struggle to maintain a competitive edge during that period. However, NUG rebounded to secure the 63rd position in January 2026 and maintained a similar ranking in February, suggesting a recovery and potential growth in market share. The fluctuations in rankings highlight the challenges and opportunities NUG faces in this category, indicating a need for strategic adjustments to capitalize on growth opportunities in the Oregon market.
Competitive Landscape
In the competitive landscape of the California pre-roll market, NUG has shown a notable upward trend in its rankings over the past few months. Starting from a rank of 37 in November 2025, NUG improved to 28 by January 2026 and maintained this position in February 2026. This positive trajectory indicates a strengthening market presence, likely driven by strategic initiatives or product offerings that resonate well with consumers. In contrast, Jetty Extracts and Sublime Canna have experienced fluctuations, with ranks mostly outside the top 30, suggesting potential challenges in maintaining consistent consumer interest. Meanwhile, Fig Farms and City Roots have maintained relatively stable positions, often ranking slightly higher than NUG, but without the same upward momentum. This competitive analysis highlights NUG's potential to continue climbing the ranks if it sustains its current growth trajectory and addresses the competitive pressures from these established brands.
Notable Products
In February 2026, the top-performing product from NUG was the Sativa Pre-Roll 1g, reclaiming its number one rank from January, with sales of 10,309 units. The Indica Pre-Roll 1g slipped to the second position after leading in January. Indica Pre-Roll 5-Pack 5g showed a steady rise, climbing to third place from its consistent fourth-place standing in previous months. The Hybrid Pre-Roll 5-Pack 5g improved its rank to fourth, while the Hybrid Pre-Roll 1g dropped to fifth place. Notably, the Sativa Pre-Roll 1g has maintained a strong presence at the top, consistently ranking first or second over the past months.
Top Selling Cannabis Brands
Data for this report comes from real-time sales reporting by participating cannabis retailers via their point-of-sale systems, which are linked up with Headset’s business intelligence software. Headset’s data is very reliable, as it comes digitally direct from our partner retailers. However, the potential does exist for misreporting in the instance of duplicates, incorrectly classified products, inaccurate entry of products into point-of-sale systems, or even simple human error at the point of purchase. Thus, there is a slight margin of error to consider. Brands listed on this page are ranked in the top twenty within the market and product category by total retail sales volume.

