May-2026
Sales
Trend
6-Month
Product Count
SKUs
Avg Price
YoY Sales Change
YoY Price Change
Market Insights Snapshot
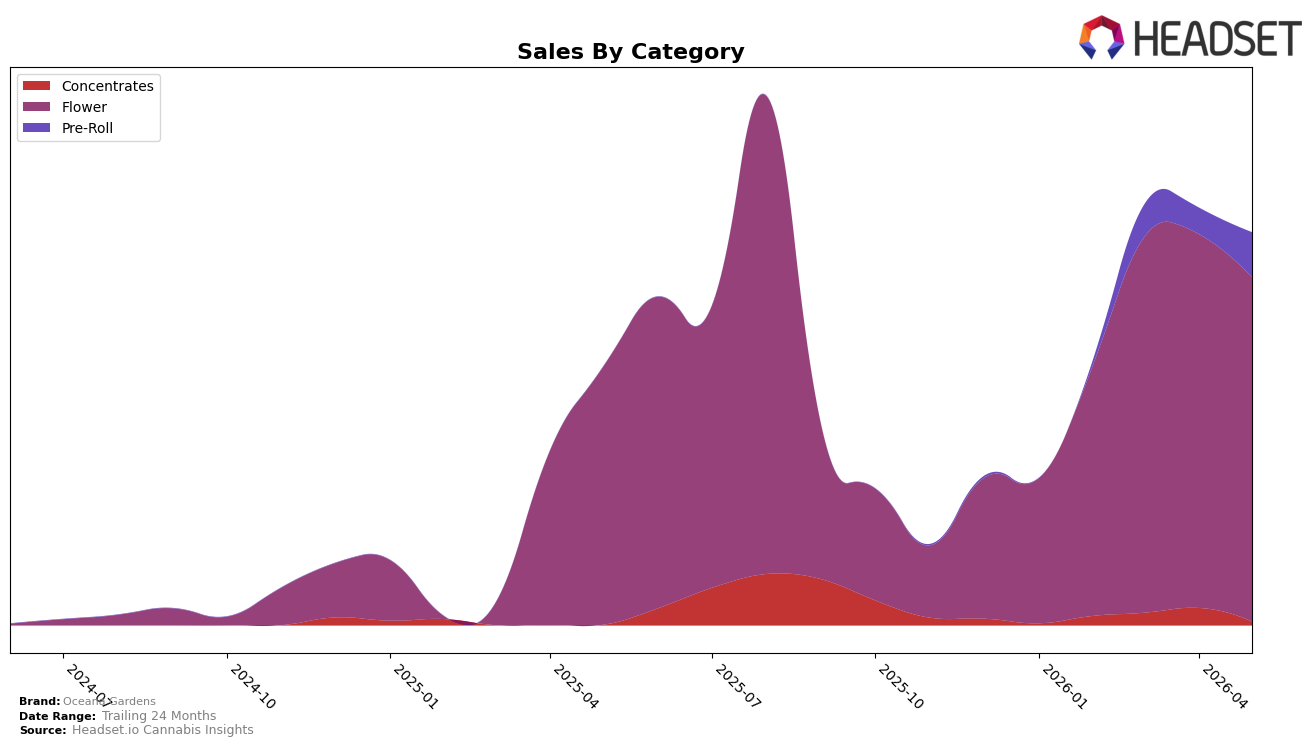
Oceana Gardens concentrated 87.68% of May 2026 sales in Flower, with that category up 33.25% year over year but down 7.96% month over month, while Pre-Roll rose to 11.43% share on a 71.40% month over month increase and Concentrates held 0.89% share after a 79.64% month over month drop but a 719.57% year over year spike. The brand’s average price fell 61.80% year over year to $5.36 even as overall brand sales grew 51.72% year over year, and within its core the Flower category held a Michigan rank of 30; this mix implies a volume-led strategy where lower price points are expanding unit throughput while category breadth is being tested at the margins.
The tilt toward Flower at 87.68% share alongside a Pre-Roll surge of 71.40% month over month suggests Oceana Gardens is using entry-priced formats to capture incremental baskets, while the Concentrates pattern — 719.57% year over year growth but a 79.64% month over month pullback — indicates episodic supply or promotional cycles rather than stable demand. Holding rank 30 in Michigan Flower while cutting average prices by 61.80% year over year signals a trade‑down environment where the brand defends shelf position through affordability, implying near-term positioning as a value-forward Flower player with selective Pre-Roll expansion rather than a diversified premium portfolio.
Competitive Landscape
Oceana Gardens sits at rank #30 in MI Flower for May 2026, improving 11 positions year over year from #41 to #30 and rising 9 spots from #39 three months ago, while still 7 places below its peak of #23 from August 2025; in contrast, Goodlyfe Farms advanced from #7 to #2 and Grown Rogue jumped from #29 to #5 as of May 2026, indicating that faster upward mobility among competitors is compressing the mid-tier even as Oceana Gardens climbs, and the trajectory implies that sustaining sequential rank gains will require closing the gap to the low-teens where leadership churn is accelerating.

Notable Products
Hella Jelly (14g) posted the steepest decline in May 2026 at -27.7% MoM, sliding to rank 8 while Donutz (Bulk) dipped a milder -3.9% MoM at rank 7, implying Flower lost momentum relative to other formats. In contrast, Donutz Pre-Roll (1g) surged +62.9% MoM to rank 2 and Chicken N' Waffles Pre-Roll (1g) climbed +62.0% MoM to rank 3, while GG4 (Bulk) was nearly flat at +1.4% MoM in rank 10; with six of the top ten as Pre-Roll SKUs, the assortment is tilting toward faster-turn inhalables. Bigfoot Glue Pre-Roll (1g) held rank 1 despite no reported MoM rate, and the pre-roll cohort from ranks 1–6 suggests mix is consolidating around single-gram formats even as Flower carries the single largest dollar line at $46,337. The pattern implies Oceana Gardens is shifting volume toward branded pre-rolls where momentum is compounding, while Flower requires SKU-level pruning to avoid drag from underperformers.
Top Selling Cannabis Brands
Data for this report comes from real-time sales reporting by participating cannabis retailers via their point-of-sale systems, which are linked up with Headset’s business intelligence software. Headset’s data is very reliable, as it comes digitally direct from our partner retailers. However, the potential does exist for misreporting in the instance of duplicates, incorrectly classified products, inaccurate entry of products into point-of-sale systems, or even simple human error at the point of purchase. Thus, there is a slight margin of error to consider. Brands listed on this page are ranked in the top twenty within the market and product category by total retail sales volume.

