.svg)

Sep-2026
Sales
Trend
6-Month
Product Count
SKUs
Avg Price
YoY Sales Change
YoY Price Change



Where to Buy
All:Hours is stocked at 42 licensed dispensaries across Connecticut, with the deepest coverage in Hamden, Norwalk, West Hartford, Bristol, and Manchester. Search by ZIP code or city below to find the closest one, or filter by product type if you are after a specific format.
Market Insights Snapshot
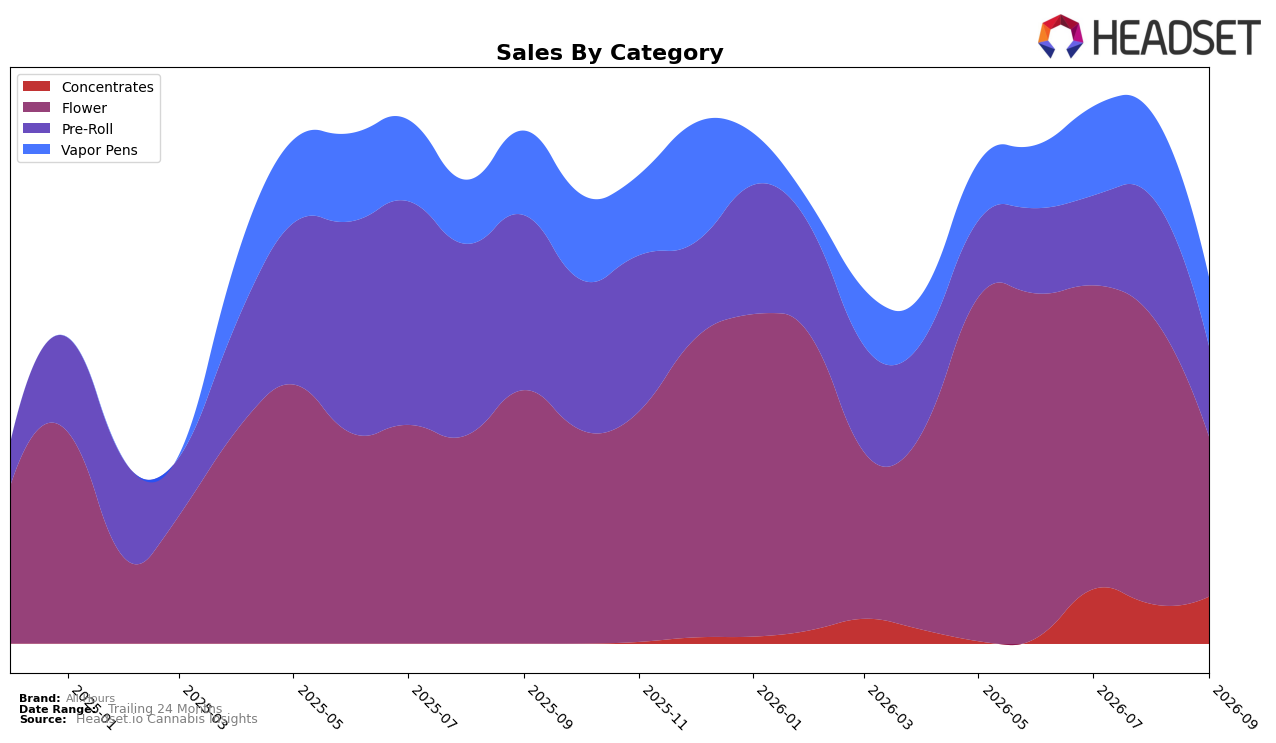
All:Hours concentrated 43.55% of sales in Flower during September 2026 while Pre-Roll held 24.67%, yet both categories contracted sharply with Flower down 37.36% year over year and 45.07% month over month, and Pre-Roll down 48.54% year over year and 24.15% month over month. Vapor Pens accounted for 18.83% share with declines of 18.62% year over year and 18.47% month over month, whereas Concentrates rose 18.73% month over month to 12.95% share despite lacking a year-over-year baseline; against this mix, All:Hours averaged $42.07 and maintained a Flower rank of 10 in Connecticut. The pattern implies overexposure to Flower and Pre-Roll volatility is pulling total brand sales down 28.87% year over year, while incremental momentum in Concentrates is too small at 12.95% share to offset double-digit declines in the two largest categories.
With Flower at a 43.55% mix and ranked 10 in Connecticut, month-over-month declines of 45.07% in that anchor category and 24.15% in Pre-Roll signal a positioning tied to declining inhalable segments rather than to steadier or expanding formats. The 18.73% month-over-month gain in Concentrates alongside a smaller 18.47% month-over-month decline in Vapor Pens suggests a pivot opportunity toward higher-momentum subsegments, but the current 12.95% share in Concentrates and 18.83% in Vapor Pens indicate insufficient scale to counterbalance a 37.36% year-over-year slide in Flower and a 48.54% year-over-year slide in Pre-Roll; the implication is that mix reallocation, not price (up 8.43% year over year), will be the primary lever to stabilize rank and reverse the 28.87% brand sales decline.
Competitive Landscape
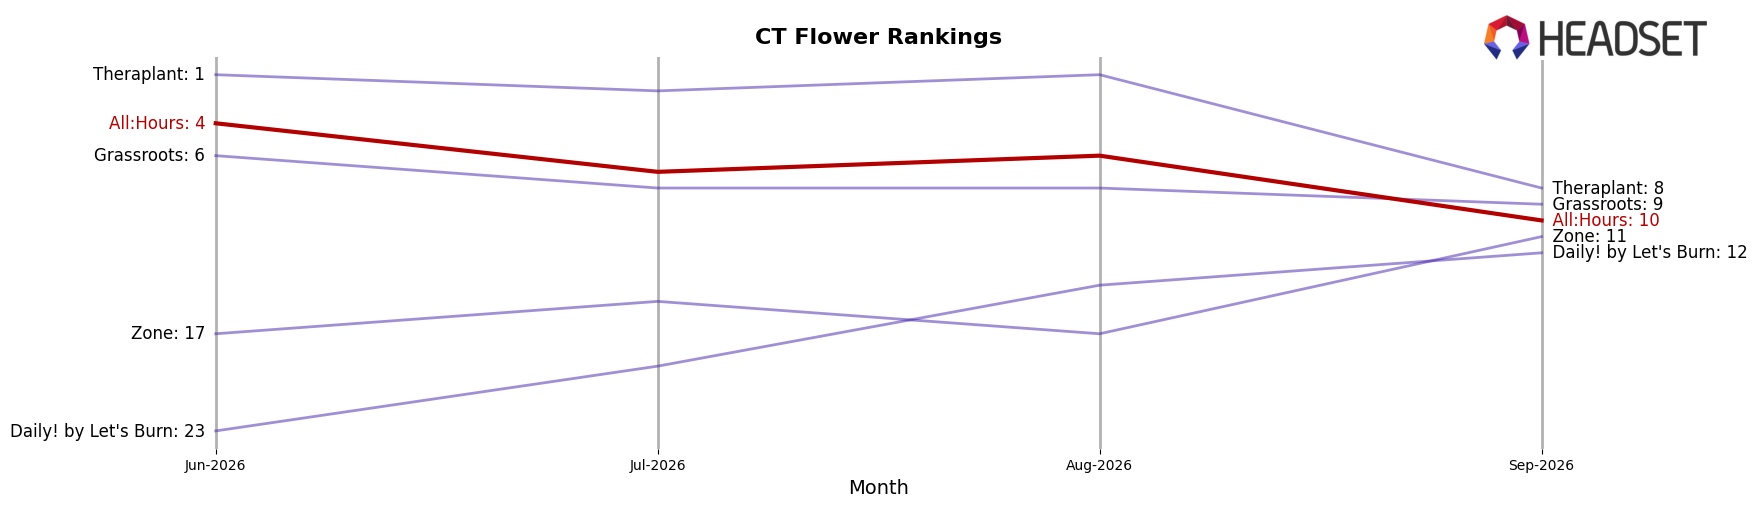
All:Hours sits at rank #10 in CT Flower for September 2026, down 1 position year over year from #9 and sliding 6 spots from its three-month mark of #4, while its peak of #4 in June 2026 marks a 6-rank gap from today; meanwhile, Let's Burn holds #1 and Savvy is #2 despite a -26.8% YoY sales change, with Find. rising to #3 on +124.1% YoY sales and RYTHM at #5 on +25.2% YoY growth; compared to June 2026, the September 2026 rank compression against faster-growing rivals indicates All:Hours is ceding share momentum to uptrending competitors and will need to reverse the three-month, six-rank decline to avoid further displacement.
Notable Products
Sour Zoda (3.5g) is the headline movement in September 2026 with a -29.3% month-over-month drop while sitting at rank 2, and Sour Zoda Bubble Hash Infused Shorties Pre-Roll 4-Pack (1.6g) at rank 1 also contracted by -11.0% MoM, signaling demand compression at the very top. Hash Burger Rosin Infused Shorties Pre-Roll 4-Pack (1.6g) rose +24.7% MoM at rank 5, but that gain did not offset the double-digit declines in the leading Sour Zoda family. Four of the top ten are Flower SKUs occupying ranks 2, 3, and 9 alongside one additional Flower entry, yet the only double-digit MoM increases are absent in Flower while the steepest contraction of -29.3% sits there, implying mix risk concentrated in a weakening Flower core.
Top Selling Cannabis Brands






Data for this report comes from real-time sales reporting by participating cannabis retailers via their point-of-sale systems, which are linked up with Headset’s business intelligence software. Headset’s data is very reliable, as it comes digitally direct from our partner retailers. However, the potential does exist for misreporting in the instance of duplicates, incorrectly classified products, inaccurate entry of products into point-of-sale systems, or even simple human error at the point of purchase. Thus, there is a slight margin of error to consider. Brands listed on this page are ranked in the top twenty within the market and product category by total retail sales volume.

