Jun-2026
Sales
Trend
6-Month
Product Count
SKUs
Avg Price
YoY Sales Change
YoY Price Change
Market Insights Snapshot
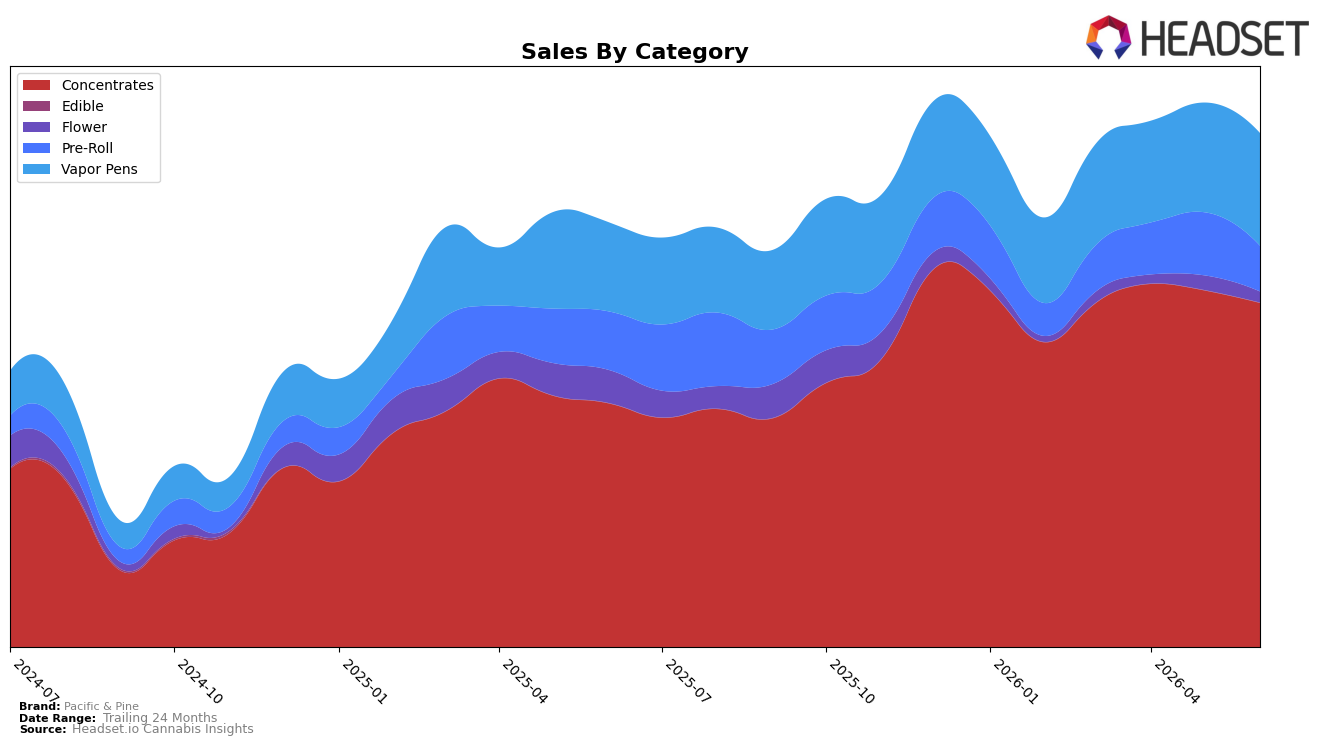
Pacific & Pine concentrated its June 2026 mix in Concentrates at 67.10% share with 41.25% year-over-year growth but a 3.50% month-over-month dip, while Vapor Pens held 21.93% share with 26.37% YoY and 2.72% MoM gains; by contrast, Pre-Roll fell 21.91% YoY and 27.69% MoM at 8.86% share, and Flower contracted 67.18% YoY and 24.95% MoM at 2.10% share. Across the portfolio, brand sales grew 21.05% YoY and average price rose 2.80%, pointing to a deliberate shift toward higher-value inhalables as declining Pre-Roll and Flower—down 27.69% and 24.95% MoM respectively—cede mix to Concentrates and Vapor Pens, implying the brand is leaning into potency-led formats over value-led ones.
With Concentrates anchoring 67.10% of sales and ranking 10th in Washington, the 3.50% MoM softness paired with a 41.25% YoY gain suggests repeat velocity is stable but near-term replenishment cycles may be lengthening, while Vapor Pens’ 2.72% MoM uptick and 26.37% YoY growth at 21.93% share provides a hedge against Concentrates volatility. The steep contractions in Pre-Roll and Flower—21.91% and 67.18% YoY respectively—compress trial formats, so sustaining the 21.05% YoY brand growth likely depends on converting more share into the two inhalable cores and tightening average price bands around $17.16 without eroding the 2.80% YoY price lift, implying a positioning centered on potency and device convenience rather than breadth across classic smokables.
Competitive Landscape
Pacific & Pine sits at rank #10 in Washington Concentrates in June 2026, improving 6 spots from #16 year over year but slipping 1 place from #9 over the last three months; it also retreated from its peak of #8 reached in April 2026, while category leaders show mixed momentum as Constellation Cannabis advanced from #7 to #3 alongside a 44.1% YoY sales increase and Ooowee held #1 despite a 6.8% YoY sales decline. Compared with mid-pack rivals, Dabstract climbed from #5 to #4 with 23.5% YoY growth while Oleum Extracts (Oleum Labs) slipped from #4 to #5 with just 0.2% YoY sales growth, indicating that Pacific & Pine’s upward YoY rank change alongside short-term softening implies an at-risk foothold: progress over 12 months is real, but holding a top-10 position will require reversing the recent drift from April 2026 to June 2026 as faster-growing competitors compress the middle ranks.

Notable Products
Strawberry Runtz Live Hash Rosin (1g) posted the steepest movement in June 2026 with a -32.6% month-over-month drop and slid to rank 7, while Orange Fruit Snax Live Hash Rosin (1g) held rank 1 despite a -19.1% decline. Blueberry Diesel Solventless Live Hash Rosin (1g) at rank 2 also contracted by -9.8%, whereas Garlic Mimosa Live Hash Rosin (1g) climbed 40.2% to rank 6. With all top ten SKUs concentrated in Concentrates and two products—Purple Pineapple Live Hash Rosin (1g) up 19.3% at rank 4 and Super Boof Solventless Hash Cold Cured Rosin (1g) up 15.5% at rank 3—offsetting leadership declines, the mix implies Pacific & Pine is leaning into depth within Concentrates while refreshing flavor SKUs to stabilize share.
Top Selling Cannabis Brands
Data for this report comes from real-time sales reporting by participating cannabis retailers via their point-of-sale systems, which are linked up with Headset’s business intelligence software. Headset’s data is very reliable, as it comes digitally direct from our partner retailers. However, the potential does exist for misreporting in the instance of duplicates, incorrectly classified products, inaccurate entry of products into point-of-sale systems, or even simple human error at the point of purchase. Thus, there is a slight margin of error to consider. Brands listed on this page are ranked in the top twenty within the market and product category by total retail sales volume.

