May-2026
Sales
Trend
6-Month
Product Count
SKUs
Avg Price
YoY Sales Change
YoY Price Change
Market Insights Snapshot
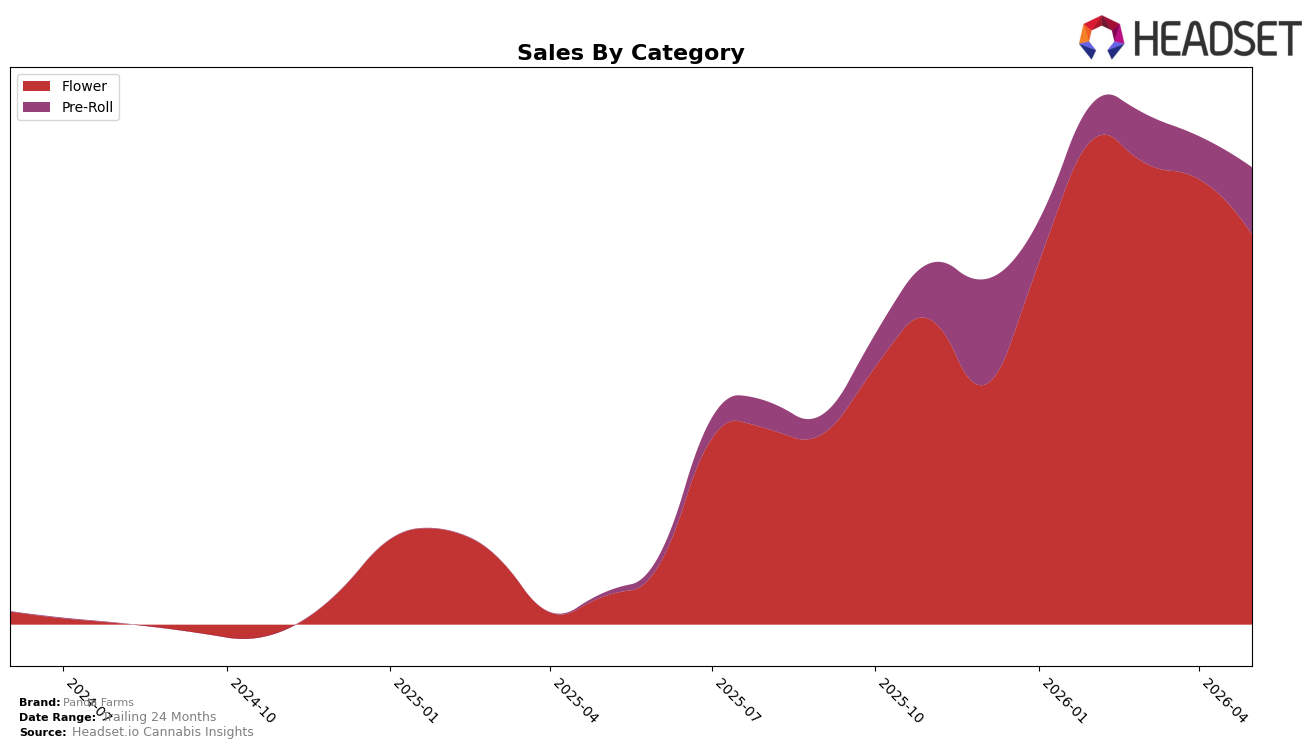
In May 2026, Panda Farms concentrated 85.33% of sales in Flower while Pre-Roll accounted for 14.67%, with Flower ranking at 17 in Oregon Flower. Year over year, Flower expanded 1315.17% and Pre-Roll grew 1897.96%, while month over month Flower declined 12.47% and Pre-Roll rose 57.12%; alongside this category skew, the brand’s overall average price fell 42.49% YoY, implying mix- and price-led volume expansion. The pattern implies Panda Farms is leveraging aggressively priced Flower to anchor scale while accelerating into Pre-Roll as a growth wedge despite the Flower rank of 17 in Oregon.
The shift toward a larger Pre-Roll contribution (14.67% share) combined with a 57.12% MoM surge, versus a 12.47% MoM pullback in Flower, indicates a diversification that can cushion category volatility and improve shelf breadth at an average price of $14.89. With Flower up 1315.17% YoY but still at rank 17 in Oregon, and Pre-Roll up 1897.96% YoY, the brand’s positioning tilts toward value-accessible formats that convert at lower price points, implying that sustaining growth will hinge on maintaining price architecture while gradually trading up within Flower and cross-selling into Pre-Roll to raise overall rank and share.
Competitive Landscape
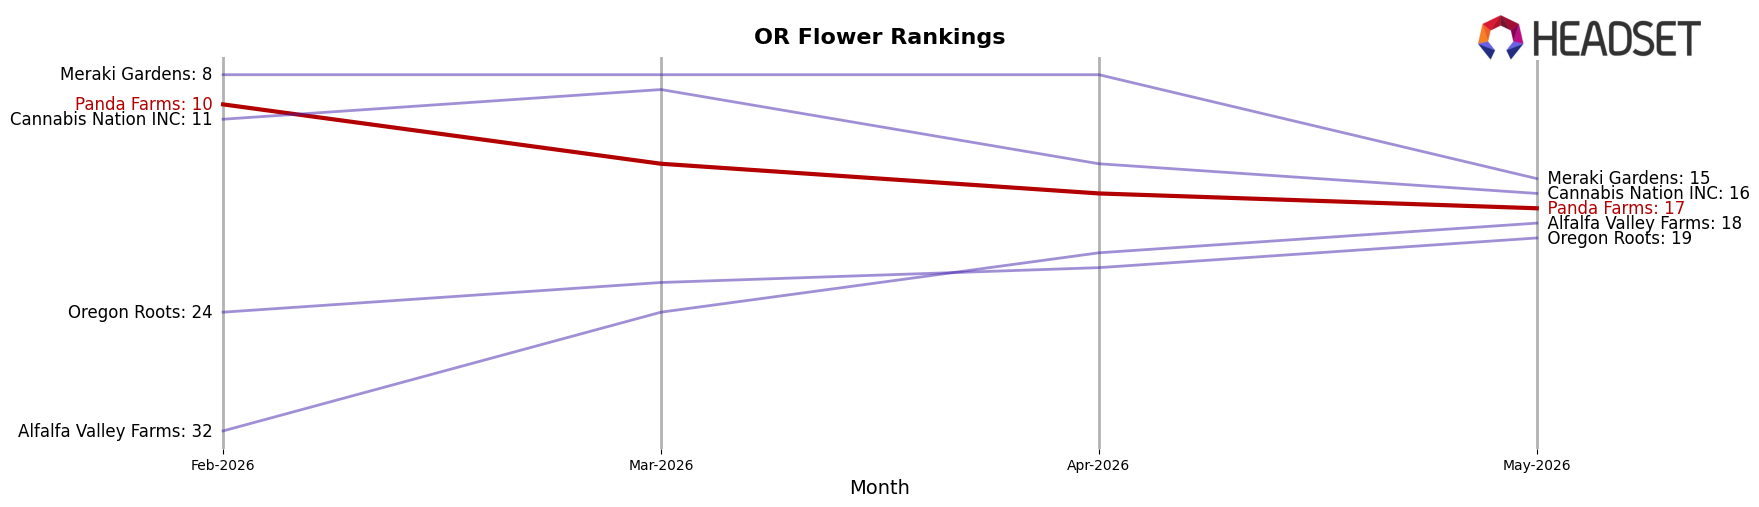
Panda Farms sits at rank #17 in OR Flower for May 2026, a rise of 175 positions from #192 a year earlier, but down 7 places from #10 in February 2026, implying a rebound year that cooled after a winter peak. Meanwhile, PRUF Cultivar / PRŪF Cultivar held #1 with a 0-position YoY change while growing sales 23.9%, and Otis Garden advanced to #5 from #20 with 101.4% YoY sales growth, indicating that Panda Farms’ jump from #192 to #17 trails leaders that either maintained top ranks or climbed faster. The pattern—peaking at #10 in February 2026 then sliding to #17 while rivals climbed or consolidated—implies Panda Farms converted YoY momentum into mid-tier relevance but must stabilize rank against accelerating competitors.
Notable Products
Cap Junky (Bulk) delivered the standout movement with a 293% month-over-month surge into rank 2, while Mule Fuel (Bulk) slid 27% to rank 6, marking the steepest decline among tracked SKUs. Jack Herer B-Buds (3.5g) held rank 1 as the top seller with $42,117, and Gastronaut (Bulk) fell 22% while landing at rank 9. With eight of the top ten positioned in Flower, the mix indicates Panda Farms is consolidating share around high-volume bulk Flower, using a breakout winner to offset volatility in legacy bulk strains.
Top Selling Cannabis Brands
Data for this report comes from real-time sales reporting by participating cannabis retailers via their point-of-sale systems, which are linked up with Headset’s business intelligence software. Headset’s data is very reliable, as it comes digitally direct from our partner retailers. However, the potential does exist for misreporting in the instance of duplicates, incorrectly classified products, inaccurate entry of products into point-of-sale systems, or even simple human error at the point of purchase. Thus, there is a slight margin of error to consider. Brands listed on this page are ranked in the top twenty within the market and product category by total retail sales volume.

