Jun-2026
Sales
Trend
6-Month
Product Count
SKUs
Avg Price
YoY Sales Change
YoY Price Change
Market Insights Snapshot
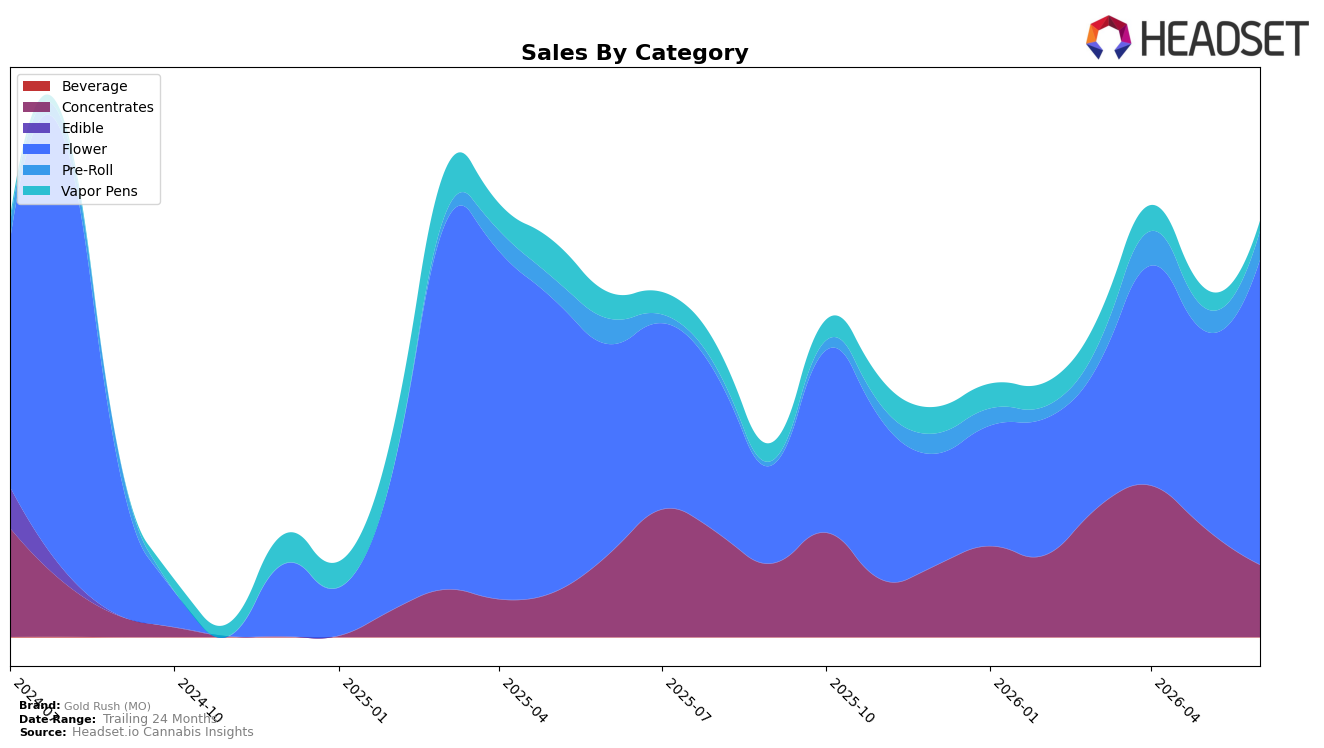
Gold Rush (MO) concentrated 73.44% of June 2026 sales in Flower, up 55.04% month over month and 44.89% year over year, while Pre-Roll held 6.86% share with 25.39% MoM and 12.90% YoY growth. In contrast, Concentrates at 17.33% share declined 33.98% MoM and 12.30% YoY, and Vapor Pens at 2.37% share fell 48.99% MoM and 62.21% YoY. With Flower ranked 40th in Missouri and the brand’s average price down 15.25% YoY to $26.54, the mix shift toward Flower and Pre-Roll implies volume-led gains concentrated in lower-price segments while higher-price inhalables contract.
The pivot toward Flower (+55.04% MoM, +44.89% YoY) alongside shrinking Vapor Pens (−48.99% MoM, −62.21% YoY) and Concentrates (−33.98% MoM, −12.30% YoY) indicates the brand is consolidating around combustion formats where it carries more share leverage. Given a 73.44% Flower mix but a state rank of 40 in Missouri, the strategy implies trading margin for velocity via lower prices and Pre-Roll add-on volume (+25.39% MoM, +12.90% YoY), which can lift total sales but may cap premium positioning unless Vapor Pens or Concentrates stabilize.
Competitive Landscape
Gold Rush (MO) sits at rank #40 in MO Flower for June 2026, improving 9 positions YoY from #49 and 10 positions since March 2026 when it was #50; despite being off its peak rank of #36 from August 2024, the brand’s relative climb suggests recovery in placement while top-tier dynamics shift. Against this backdrop, Flora Farms held #1 with a -5.06% YoY sales change while Sinse Cannabis advanced from #5 to #2 with +33.20% YoY sales growth, indicating that Gold Rush (MO)’s rise of 9 ranks YoY is occurring alongside both leader stagnation and challenger acceleration. The pattern implies that Gold Rush (MO) is gaining rank primarily through incremental share capture rather than top-tier displacement, and sustaining movement beyond #36 will likely require outpacing fast-climbing contenders.

Notable Products
Tiger Moon Pre-Roll (1g) posted the standout move in June 2026 with a 321.7% month-over-month surge to rank 1, while King Cherry Sugar Wax (1g) slid 18.0% to rank 7, indicating momentum is consolidating in ready-to-use formats as concentrates retrench. Alpine Guava #1 (3.5g) climbed 48.0% to rank 5, and two Pre-Roll SKUs sit in the top four alongside a majority of Flower entries, signaling a portfolio tilt toward accessible formats and mid-size Flower that can scale velocity. With four of the top ten in Flower and three in Pre-Roll, the concentration suggests an emphasis on breadth within inhalables rather than depth in extracts, implying Gold Rush (MO) is steering assortment toward high-turn SKUs where promotional lift translates quickly to rank gains.
Top Selling Cannabis Brands
Data for this report comes from real-time sales reporting by participating cannabis retailers via their point-of-sale systems, which are linked up with Headset’s business intelligence software. Headset’s data is very reliable, as it comes digitally direct from our partner retailers. However, the potential does exist for misreporting in the instance of duplicates, incorrectly classified products, inaccurate entry of products into point-of-sale systems, or even simple human error at the point of purchase. Thus, there is a slight margin of error to consider. Brands listed on this page are ranked in the top twenty within the market and product category by total retail sales volume.

