Market Insights Snapshot
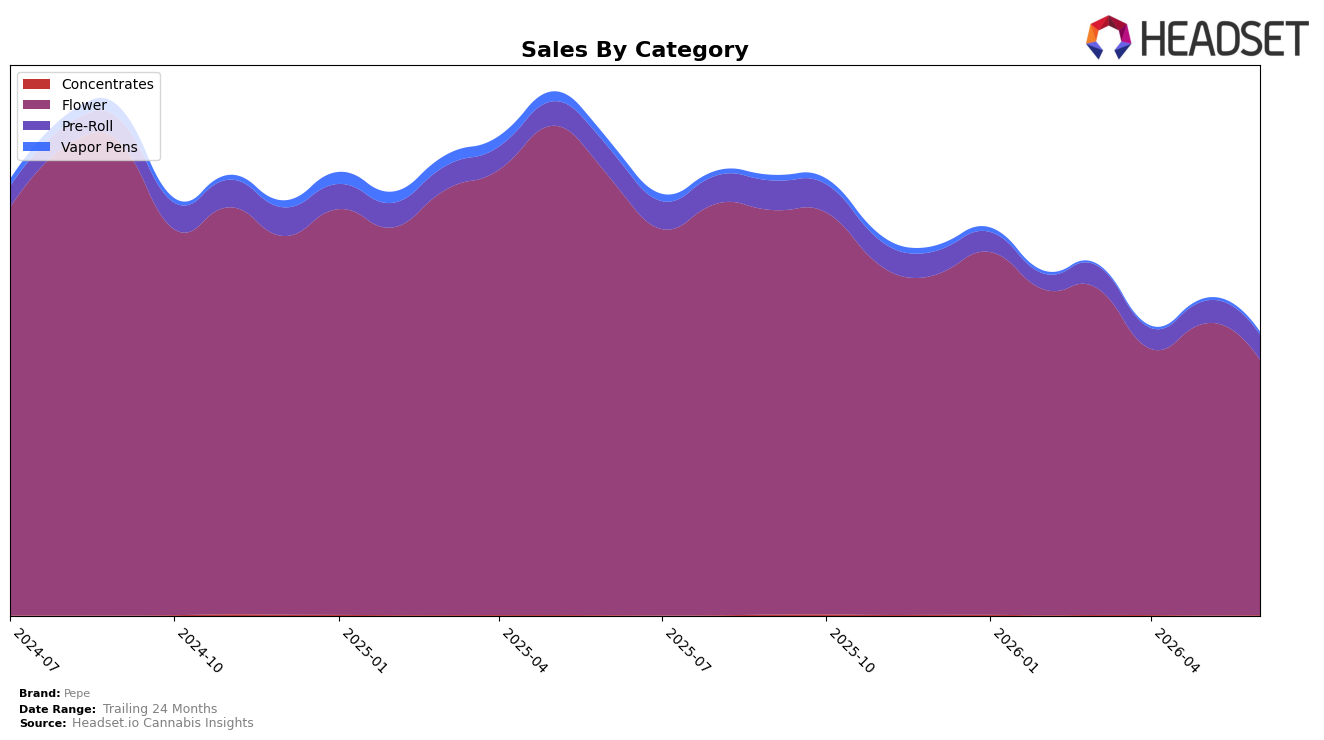
In June 2026, Pepe’s mix concentrated further in Flower at 90.18% share with a year-over-year decline of 41.96% and a month-over-month drop of 12.55%, while Pre-Roll held 8.84% share with a 11.87% YoY decline but a 12.55% MoM increase; Vapor Pens sat at 0.89% share with a 64.22% YoY decline and 9.05% MoM growth, and Concentrates, though only 0.09% share, grew 3.81% YoY and 150.83% MoM. Against a brand-level sales contraction of 40.47% YoY and a 1.57% YoY decrease in average price to $65.68, the category tilt toward Flower amplifies exposure to its sharper YoY decline and MoM softness, implying that June’s mix constrained overall resilience while small categories provided limited but accelerating offsets.
Pepe’s 13th rank in Flower in Ontario combined with a 90.18% Flower dependency suggests mid-pack positioning tied to a weakening anchor, as Pre-Roll’s 12.55% MoM growth and Vapor Pens’ 9.05% MoM growth occur from sub-9% combined share and cannot yet counter a 12.55% MoM Flower pullback. The 150.83% MoM surge in Concentrates and a 3.81% YoY uptick indicate traction in higher-variance niches, but with 0.09% share and average prices diverging from Flower’s $82.32, the current configuration implies that near-term positioning hinges on moderating Flower volatility or reweighting toward faster-moving subscale formats rather than relying on incremental price cuts.
Competitive Landscape
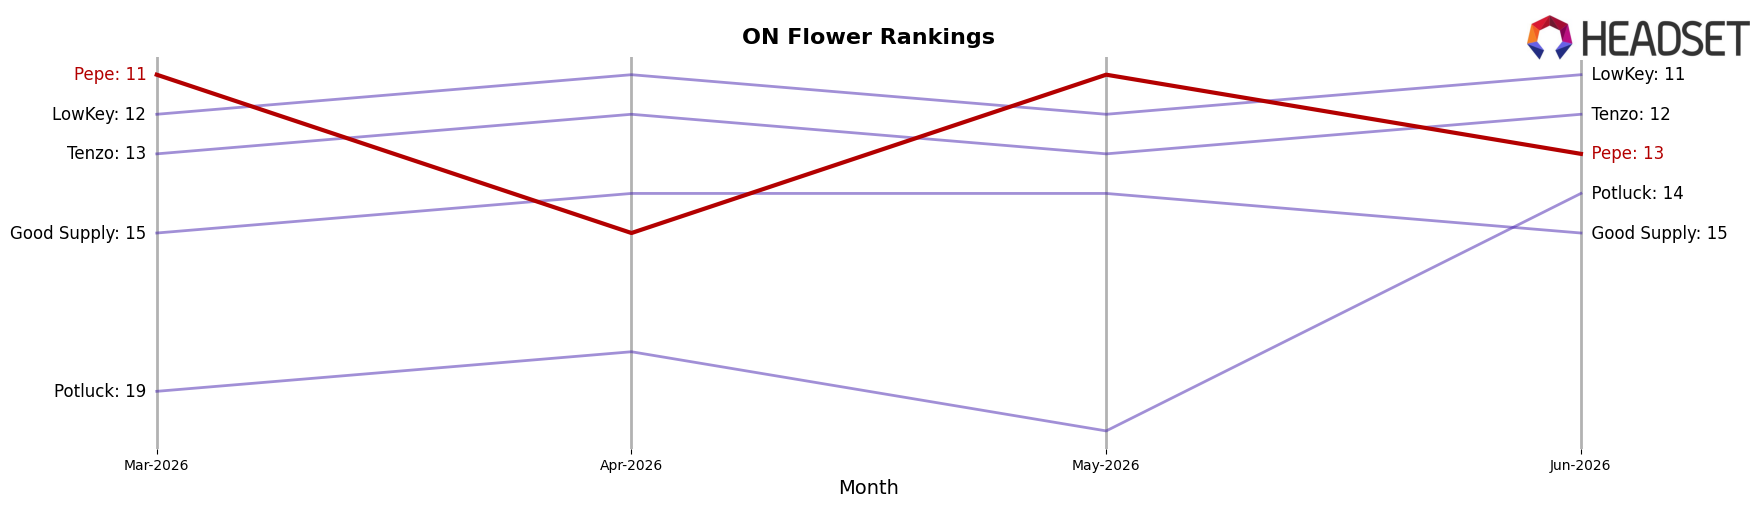
Pepe sits at #13 in Ontario Flower in June 2026, sliding 3 positions year over year from #10 while dipping 2 spots from #11 in March 2026, and this comes after a prior peak of #7 in May 2025 that is now 6 ranks higher than today. In contrast, Spinach climbed from #4 to #1 alongside a 38.28% year-over-year sales increase, and Back Forty / Back 40 Cannabis fell from #1 to #4 with an 11.25% decline, indicating that leadership is tightening at the top while mid-tier volatility grows. Pepe’s movement from #11 to #13 over the last three months and from #10 to #13 over the last twelve months implies a drift toward the lower mid-tier, suggesting that without a shift in velocity share or assortment, regression from the historical #7 peak is becoming the default trajectory.
Notable Products
11 Week Pink Pre-Roll 10-Pack (5g) posted the sharpest movement in June 2026 with a +63.0% MoM jump into rank 6, while flagship 11 Week Pink (28g) fell -26.8% yet held rank 1. Lemonatti (28g) rose +19.4% to rank 2 as Peach Tree (28g) slid -19.0% to rank 3, and Northern Lights (28g) in rank 8 inched up +6.1% as Lemonatti Pre-Roll 10-Pack (3.5g) in rank 4 dipped -9.8%. Four of the top ten are Flower SKUs concentrated in 28g formats alongside rising multi-pack Pre-Rolls, implying a trade-off where value flower retains top share while multi-pack Pre-Rolls capture incremental occasions and diversify the revenue base despite softness in smaller 3.5g formats.
Top Selling Cannabis Brands
Data for this report comes from real-time sales reporting by participating cannabis retailers via their point-of-sale systems, which are linked up with Headset’s business intelligence software. Headset’s data is very reliable, as it comes digitally direct from our partner retailers. However, the potential does exist for misreporting in the instance of duplicates, incorrectly classified products, inaccurate entry of products into point-of-sale systems, or even simple human error at the point of purchase. Thus, there is a slight margin of error to consider. Brands listed on this page are ranked in the top twenty within the market and product category by total retail sales volume.

