Jun-2026
Sales
Trend
6-Month
Product Count
SKUs
Avg Price
YoY Sales Change
YoY Price Change
Market Insights Snapshot
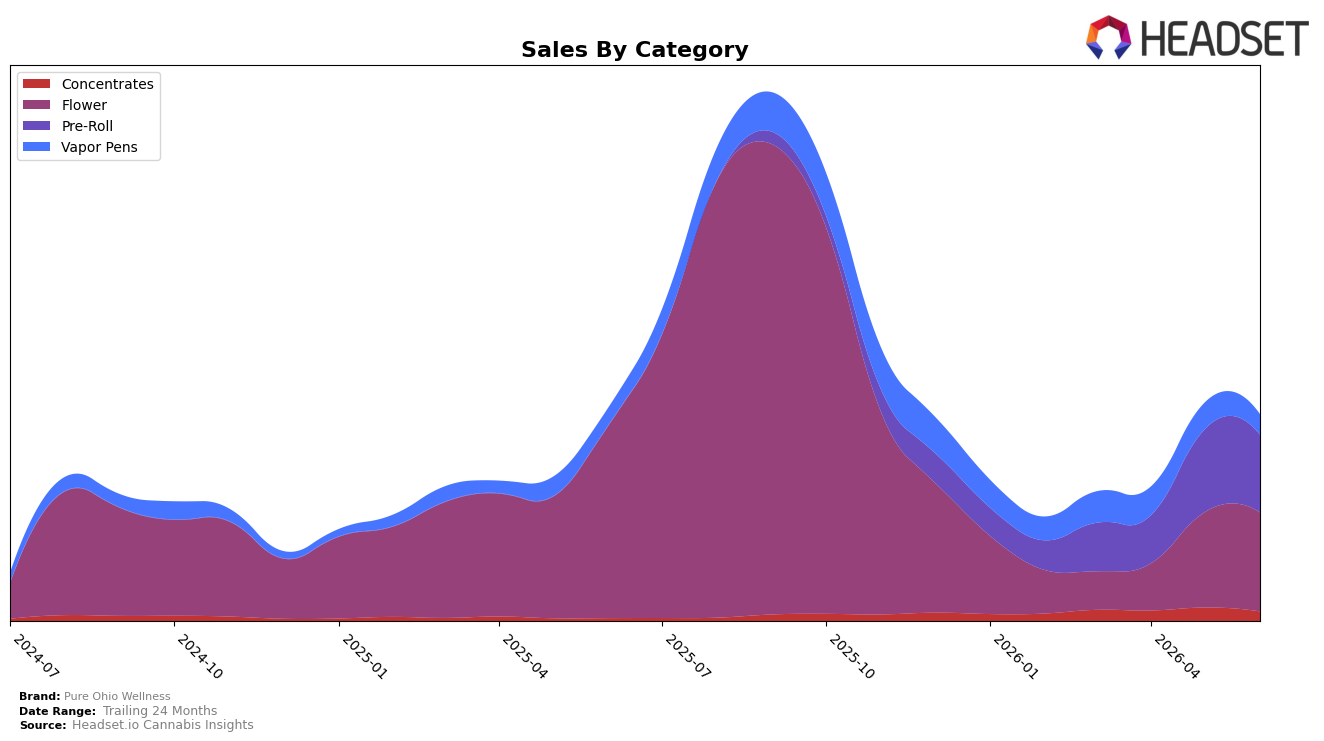
Pure Ohio Wellness concentrated 47.97% of June 2026 sales in Flower, down 48.62% year over year but up 3.93% month over month, while Pre-Roll held 37.60% share with a 6.36% month-over-month decline and no prior-year comp. Vapor Pens accounted for 9.84% share with 16.54% year-over-year growth but a 23.28% month-over-month drop, and Concentrates reached 4.59% share with 248.72% year-over-year growth offset by a 29.24% month-over-month decline; the brand averaged $17.90 per unit, a 40.48% year-over-year price reduction alongside a total brand sales change of -3.03% year over year. In Ohio Flower, the brand sat at rank 22, indicating mid-pack placement while overall 24‑month sales expanded 247.85%, and the pattern implies a pivot from heavy Flower reliance toward a broader mix where smaller categories contribute outsized growth but remain volatile month to month.
With Flower still the anchor at 47.97% share yet shrinking 48.62% year over year, the brand’s 16.54% year-over-year gain in Vapor Pens and 248.72% year-over-year surge in Concentrates suggest repositioning toward value-priced inhalables, supported by a 40.48% decline in average price. However, the simultaneous month-over-month contractions in Pre-Roll (-6.36%), Vapor Pens (-23.28%), and Concentrates (-29.24%) versus a 3.93% month-over-month lift in Flower indicate consumers reverting to core Flower when promotions or novelty wane; coupled with a rank of 22 in Ohio Flower, this implies the brand competes more on accessible pricing than on premium differentiation and would benefit from stabilizing non-Flower repeat purchasing.
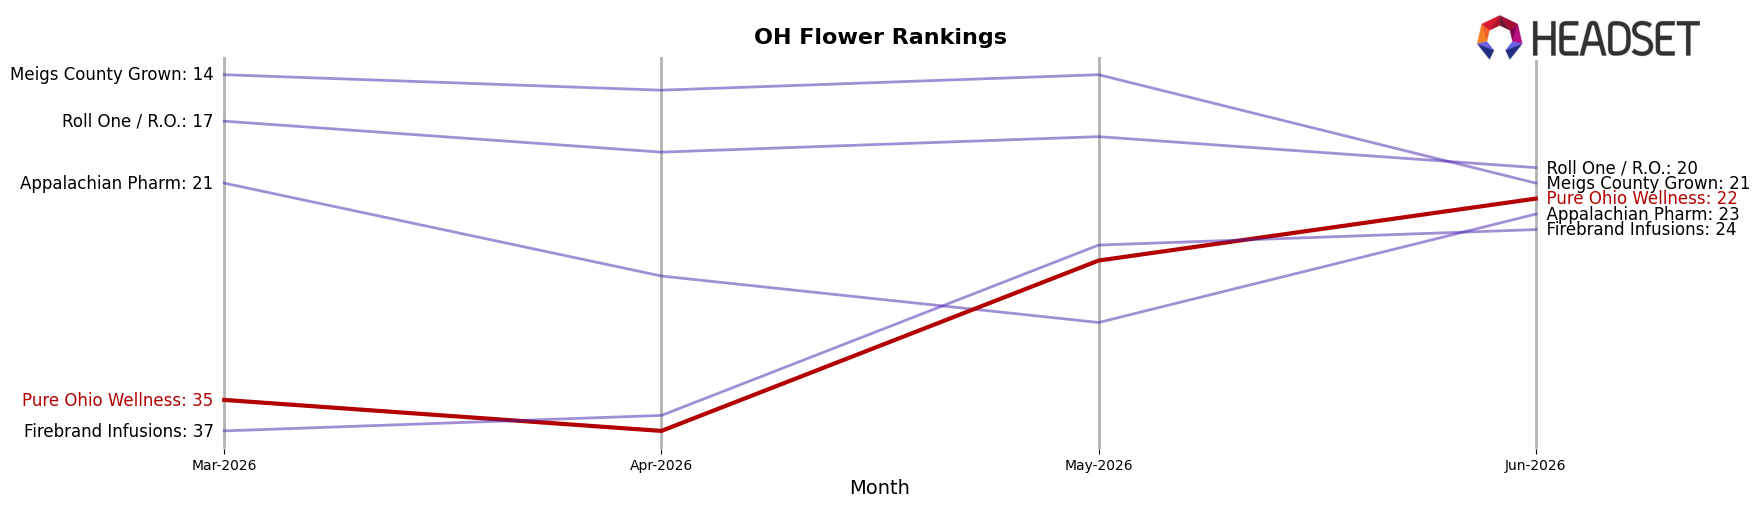
Competitive Landscape
Pure Ohio Wellness is ranked #22 in OH Flower in June 2026, down 11 positions year over year, but up 13 spots versus three months ago from #35, while its historical peak was #1 in September 2025; in contrast, Klutch Cannabis climbed to #1 with a 20-rank YoY gain and 304.8% YoY sales growth, and Riviera Creek sits at #2 despite a -22.7% YoY sales change after rising 1 rank. The mix of a double-digit YoY rank decline (-11) alongside a quarter-on-quarter recovery of 13 ranks indicates Pure Ohio Wellness is stabilizing mid-pack but losing relative position to faster-advancing leaders, implying that without catalyst SKUs or distribution shifts it risks being locked into the #20–#25 band as share consolidates at the top.
Notable Products
Hell on Wheels (2.83g) posted the steepest decline in June 2026, dropping 69.6% MoM and slipping to rank 10, while Gypsy Soap Pre-Roll (1g) fell 17.8% MoM at rank 6. In contrast, First Class Funk Pre-Roll (1g) climbed 30.8% MoM to rank 4 as Frozen Bananas Pre-Roll (1g) held the top spot at rank 1 with $47,904 in sales. Five of the top ten are Pre-Roll SKUs concentrated in ranks 1, 2, 4, 6, and 7, whereas key Flower SKUs like G Roll (2.83g) slid 26.9% MoM to rank 3 and Apple Fritter (2.83g) declined 21.1% MoM to rank 9. The pattern implies a pivot toward Pre-Rolls as the commercial engine, with Flower volatility suggesting tighter SKU rationalization or pricing work ahead.
Top Selling Cannabis Brands
Data for this report comes from real-time sales reporting by participating cannabis retailers via their point-of-sale systems, which are linked up with Headset’s business intelligence software. Headset’s data is very reliable, as it comes digitally direct from our partner retailers. However, the potential does exist for misreporting in the instance of duplicates, incorrectly classified products, inaccurate entry of products into point-of-sale systems, or even simple human error at the point of purchase. Thus, there is a slight margin of error to consider. Brands listed on this page are ranked in the top twenty within the market and product category by total retail sales volume.

