.svg)
Jun-2026
Sales
Trend
6-Month
Product Count
SKUs
Avg Price
YoY Sales Change
YoY Price Change


Market Insights Snapshot
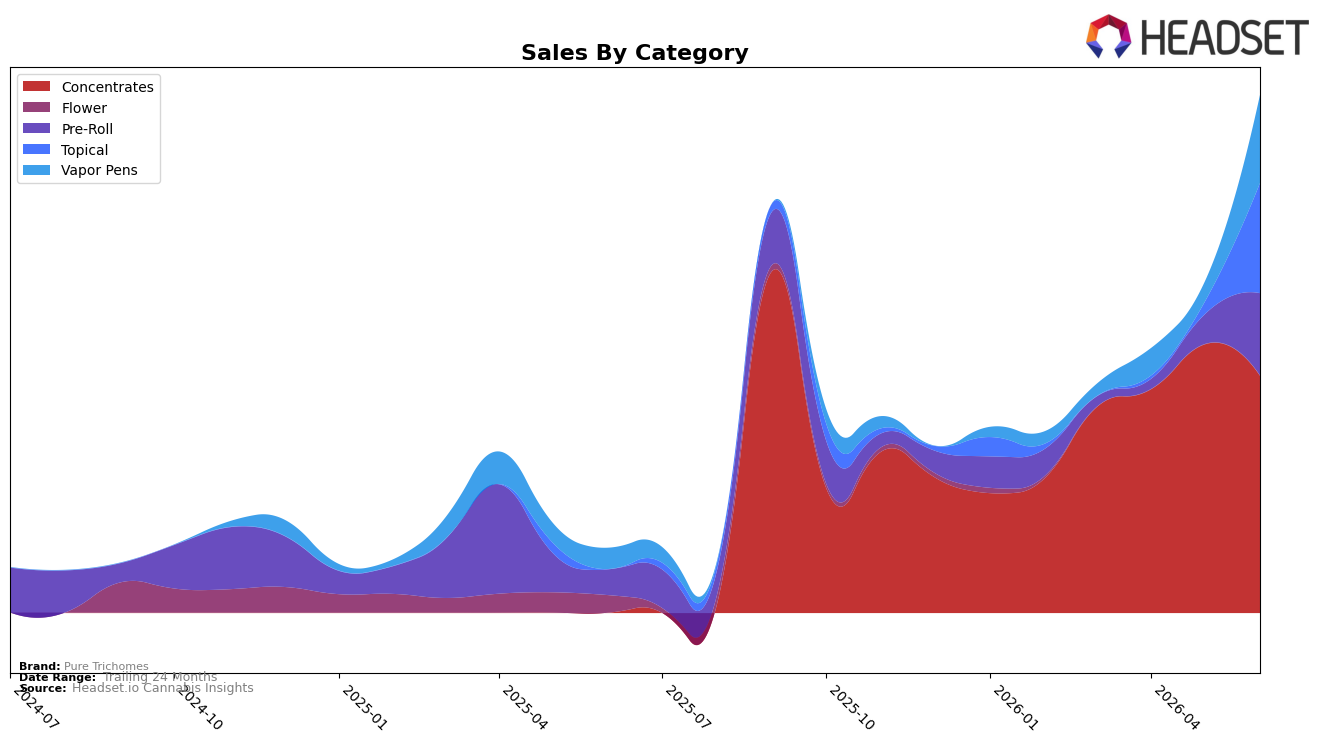
In June 2026, Pure Trichomes concentrated its revenue in Concentrates at 45.87% share with a month-over-month decline of 11.70%, while Vapor Pens expanded rapidly with 342.88% MoM growth and 318.51% YoY growth to 17.00% share. Topical surged to 21.26% share on an 812.71% MoM spike, and Pre-Roll climbed to 15.87% share with 179.47% MoM and 222.26% YoY growth; average price rose 33.36% YoY to $32.95. With Concentrates ranked 50th in Ontario and the top-category mix tilting toward faster-growing Vapor Pens and Topical, the pattern implies the brand is pivoting from a weakening lead category into higher-velocity segments to sustain the 710.83% brand-level YoY expansion.
The shift toward Vapor Pens (up 342.88% MoM to 17.00% share) and Topical (up 812.71% MoM to 21.26% share) alongside a Concentrates share at 45.87% but declining 11.70% MoM suggests portfolio rebalancing toward formats with outsized demand elasticity at higher average prices (Topical at $49.77 versus Concentrates at $31.05). Given a 33.36% YoY price lift coinciding with category diversification and a 2962.23% 24‑month sales increase, the implication is that Pure Trichomes is trading up mix while reducing reliance on a 50th-place Concentrates position in Ontario, positioning the brand for margin resilience even if the core category underperforms.
Competitive Landscape
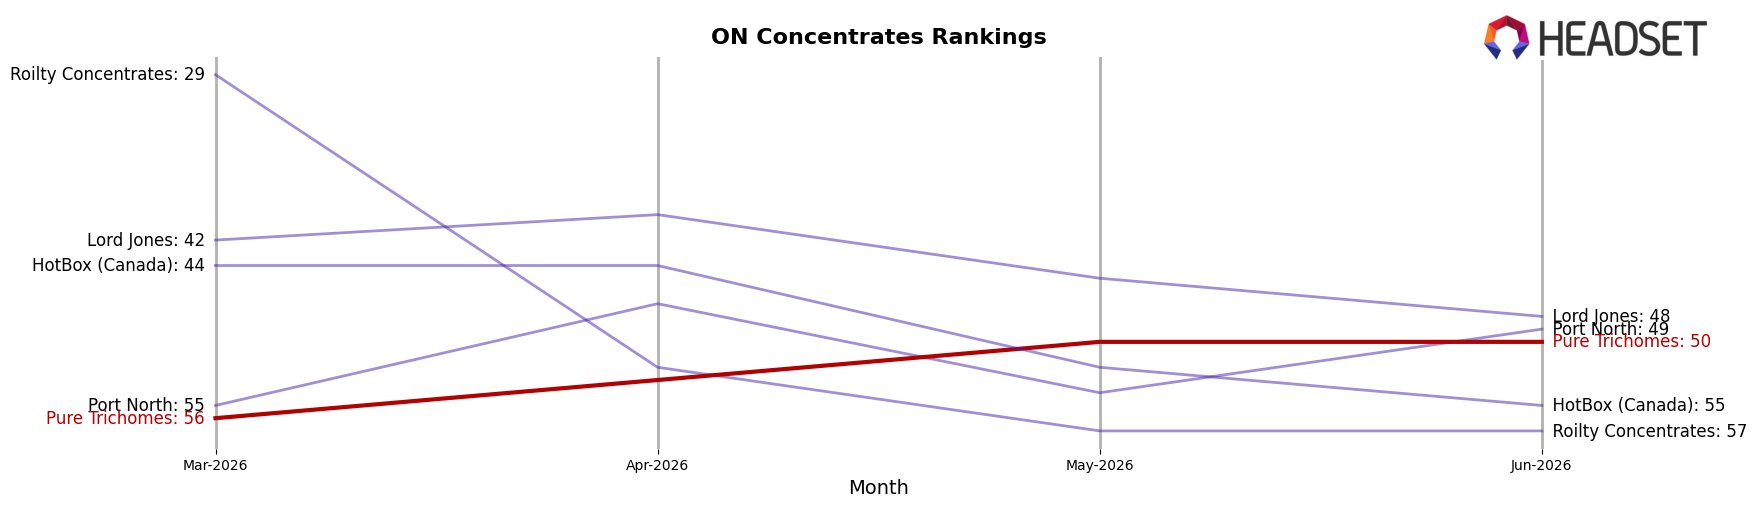
Pure Trichomes sits at rank #50 in ON Concentrates in June 2026, improving 6 positions from #56 in March 2026 but still trailing its peak of #41 from September 2025; this mid-pack placement contrasts with Vortex Cannabis Inc. holding #1 year-over-year while its sales fell 1.8%, and Pura Vida rising from #4 to #2 alongside a 49.2% sales increase, indicating that Pure Trichomes’ incremental rank gains without a corresponding leap into the top 40 point to share being consolidated by a few faster-climbing leaders.
Notable Products
CBD The Healer Maximum Strength Cream (3000mg CBD) posted the largest month-over-month surge at +812.8% to rank 4 in June 2026, while Death Mango THC Cartridge (1g) climbed +342.8% to rank 3. At the same time, Canada # 1 Hash (1.5g) held rank 1 despite a -11.7% decline, indicating leadership is concentrated but being pressured from below. The pattern implies Pure Trichomes is rapidly diversifying away from a single Concentrates anchor toward higher-growth Topical and Vapor Pens SKUs, reallocating demand across formats.
CBD:CBG 1:1 Cherry Blossom Pre-Roll 10-Pack (5g) jumped +176.1% to rank 2, and Skunkcussion Pre-Roll 3-Pack (3g) advanced +200.0% to rank 5, concentrating two of the top five in Pre-Roll. With three separate categories—Topical at rank 4, Vapor Pens at rank 3, and Pre-Roll at ranks 2 and 5—posting triple-digit gains while the incumbent Concentrates leader slipped -11.7%, the mix implies a deliberate shift toward breadth and faster-cycling formats to capture incremental shoppers and reduce category risk.
Top Selling Cannabis Brands






Data for this report comes from real-time sales reporting by participating cannabis retailers via their point-of-sale systems, which are linked up with Headset’s business intelligence software. Headset’s data is very reliable, as it comes digitally direct from our partner retailers. However, the potential does exist for misreporting in the instance of duplicates, incorrectly classified products, inaccurate entry of products into point-of-sale systems, or even simple human error at the point of purchase. Thus, there is a slight margin of error to consider. Brands listed on this page are ranked in the top twenty within the market and product category by total retail sales volume.

