.svg)

Aug-2026
Sales
Trend
6-Month
Product Count
SKUs
Avg Price
YoY Sales Change
YoY Price Change


Market Insights Snapshot
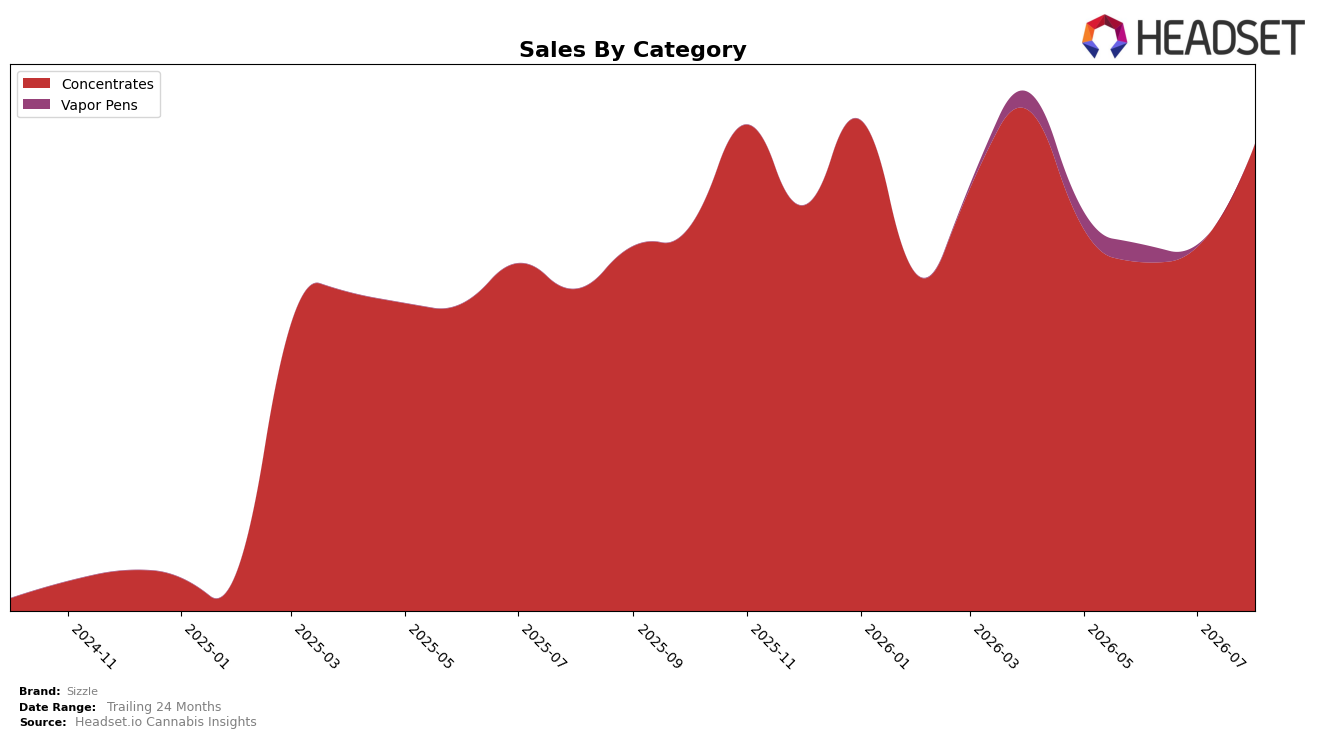
In August 2026, Sizzle concentrated entirely in Concentrates with a 100.0% category share, posting year-over-year sales growth of 45.1% alongside a month-over-month lift of 28.3%. Average price fell 8.6% YoY to $24.07 while share within the brand’s own mix remained at 100.0%, indicating that volume expansion outpaced the price decline. The pattern implies demand elasticity is favorable in Concentrates: lower prices are trading off against higher unit throughput, sustaining double-digit growth across both YoY and MoM horizons.
Within Saskatchewan Concentrates, Sizzle held rank 3 while executing a price contraction of 8.6% YoY alongside a 28.3% MoM sales increase. With 100.0% of sales in a single category and rank 3 anchoring visibility, the mix shift implies a deliberate specialization strategy where competitiveness is being pursued through price-driven velocity gains rather than multi-category diversification. The thesis is that Sizzle’s current positioning leans on depth over breadth: defending and potentially improving rank in Concentrates by trading margin for share momentum, which can scale if price elasticity persists at August 2026 levels.
Competitive Landscape
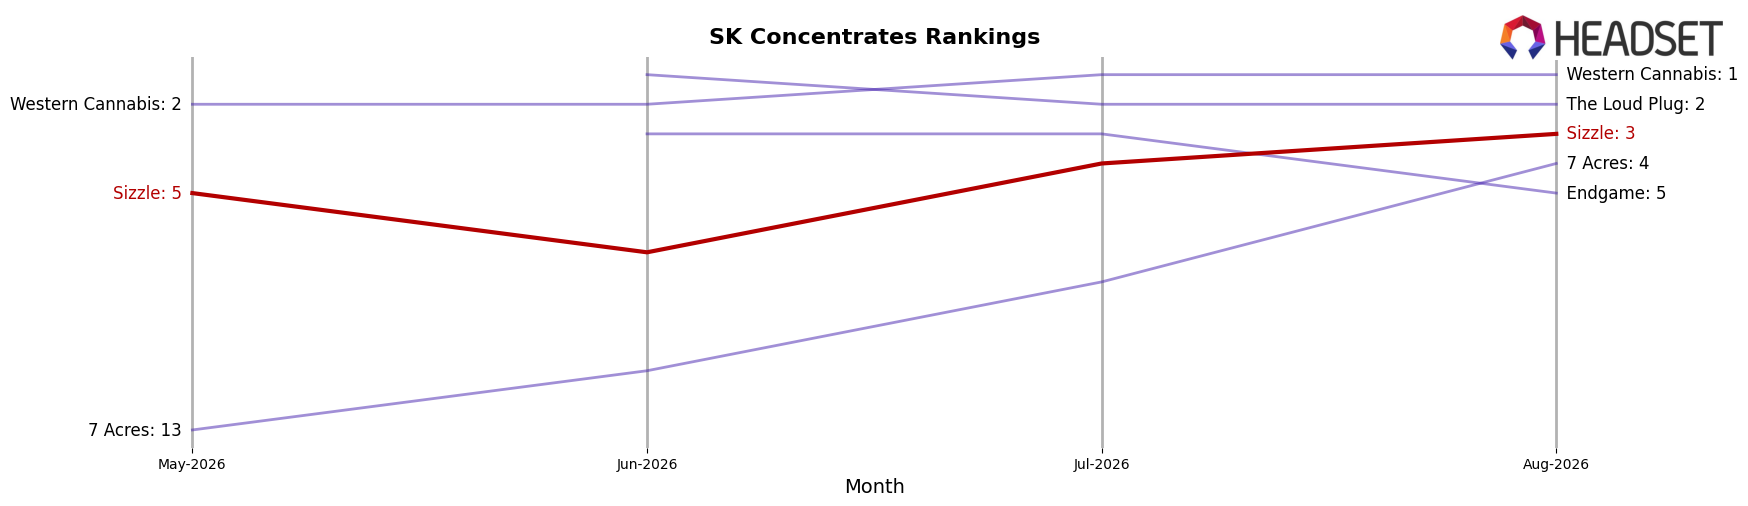
Sizzle is ranked #3 in SK Concentrates in August 2026, down 1 spot year over year from #2 but up 2 places versus May 2026 when it sat at #5; despite peaking at #1 in February 2026, it now trails Western Cannabis, which improved from #4 to #1 year over year, and The Loud Plug, which climbed from #12 to #2 alongside a 670.8% year-over-year sales lift, while Sizzle still leads 7 Acres at #4 and widened distance from Endgame at #5 with Endgame’s sales down 11.8% year over year; this mix of a short-term rebound (+2 ranks since May 2026) but a year-over-year slip (-1 rank since August 2025) implies Sizzle is stabilizing mid-top-tier but must regain velocity to re-approach its February 2026 peak position.
Notable Products
Pink Kush Shatter (1g) delivered the standout move in August 2026 with +168.6% MoM to rank 1, while White Widow Shatter (1g) climbed +53.0% to rank 2. Lavender Haze Shatter (1g) added +57.6% MoM at rank 3, and Apple Fritter Shatter (1g) fell -38.3% at rank 9. Four of the top ten are Shatter SKUs concentrated in Concentrates, and the mix shift toward high-growth Shatter at the very top implies Sizzle is consolidating share through a few breakout flavors rather than broad-based gains.
Top Selling Cannabis Brands






Data for this report comes from real-time sales reporting by participating cannabis retailers via their point-of-sale systems, which are linked up with Headset’s business intelligence software. Headset’s data is very reliable, as it comes digitally direct from our partner retailers. However, the potential does exist for misreporting in the instance of duplicates, incorrectly classified products, inaccurate entry of products into point-of-sale systems, or even simple human error at the point of purchase. Thus, there is a slight margin of error to consider. Brands listed on this page are ranked in the top twenty within the market and product category by total retail sales volume.

