Dec-2025
Sales
Trend
6-Month
Product Count
SKUs
Avg Price
YoY Sales Change
YoY Price Change
Market Insights Snapshot
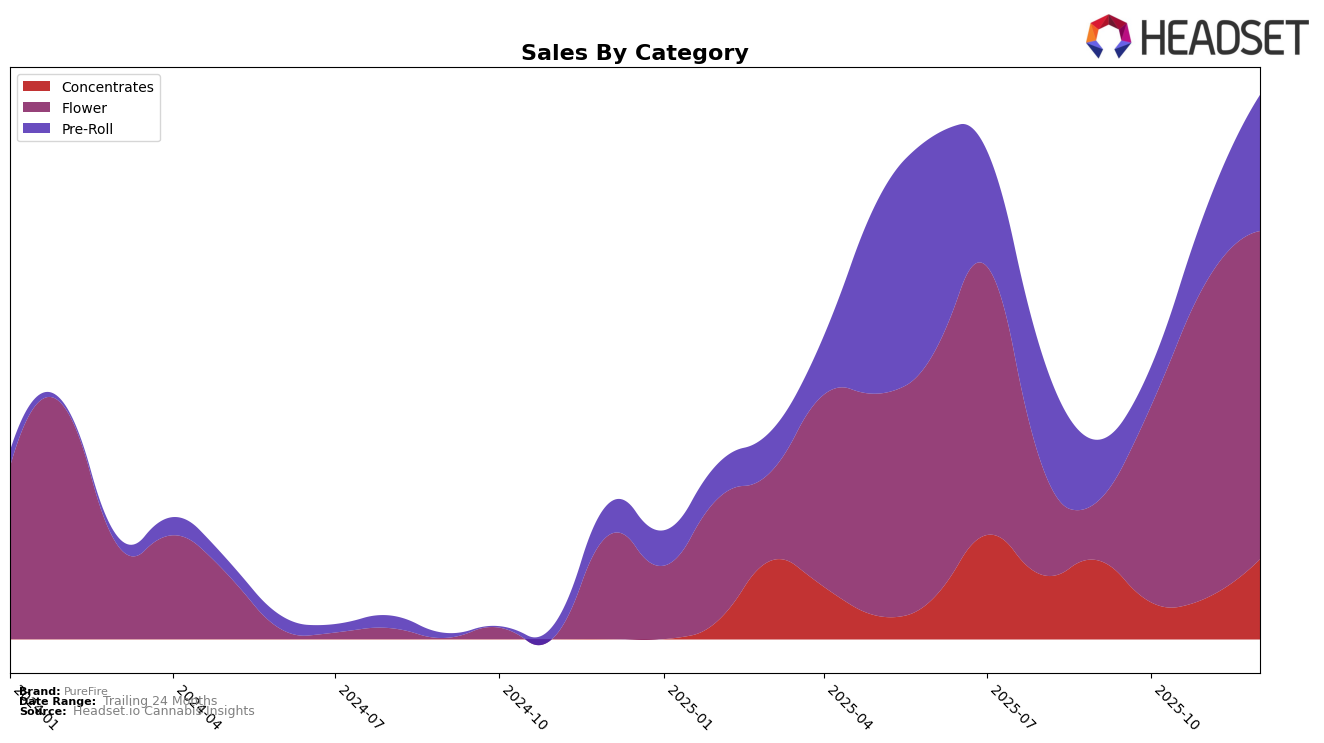
In the dynamic market of British Columbia, PureFire has shown notable fluctuations across different product categories. In the Concentrates category, the brand experienced a dip in rankings from September to November 2025, dropping out of the top 30 in November, which could indicate increased competition or shifts in consumer preference. However, PureFire rebounded to the 23rd position by December, suggesting a potential recovery or successful strategic adjustments. Meanwhile, in the Flower category, PureFire demonstrated a strong upward trajectory, climbing from 91st place in September to consistently maintain a position in the low 40s by the end of the year. This significant rise in the Flower category highlights PureFire's growing influence and appeal in this segment.
In contrast, the Pre-Roll category presents an intriguing development for PureFire in British Columbia. The brand did not appear in the top 30 rankings until December 2025, where it entered at the 80th position. This late entry into the rankings could be seen as a positive sign that PureFire is beginning to establish its foothold in the Pre-Roll market, although it indicates that there is still substantial room for growth. The absence from the top 30 in the preceding months suggests that PureFire may have recently expanded its offerings or improved its market strategy in this category. Such movements provide an insightful glimpse into the brand's evolving market strategy and areas where it may be focusing its efforts.
Competitive Landscape
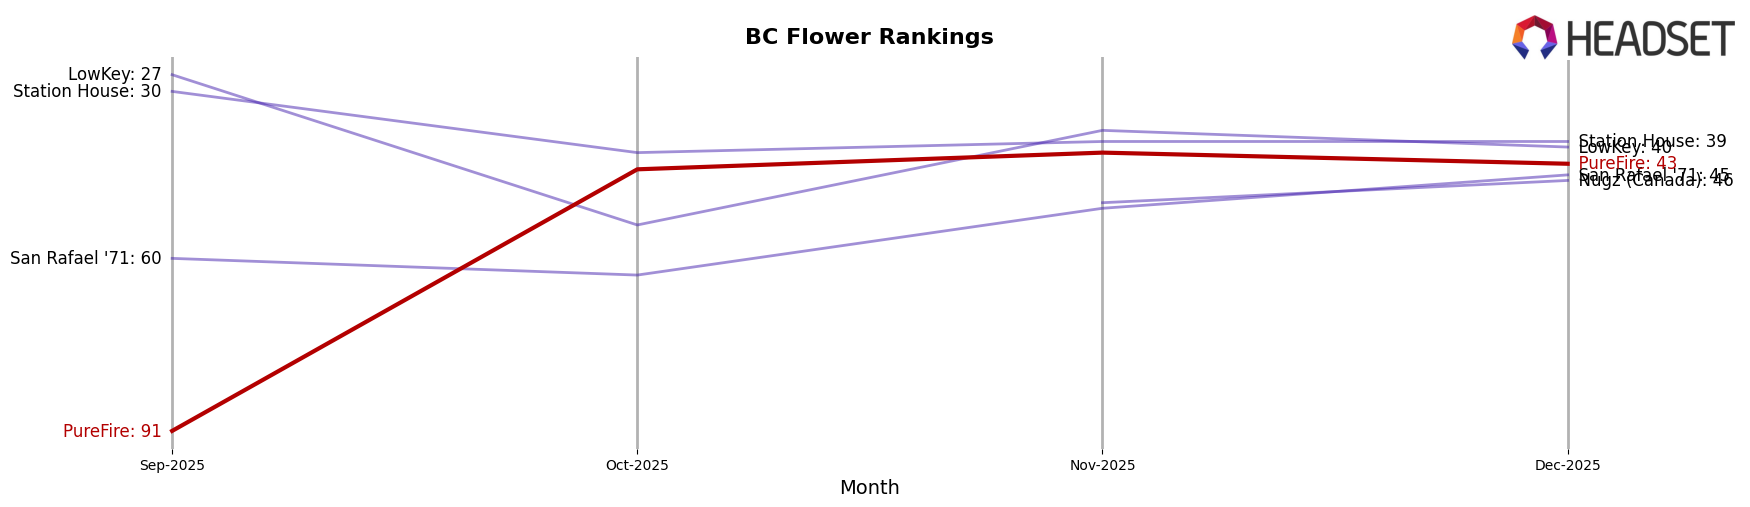
In the highly competitive Flower category in British Columbia, PureFire has demonstrated a remarkable upward trajectory in brand ranking, moving from 91st in September 2025 to a commendable 43rd by December 2025. This significant climb in rank is indicative of PureFire's growing market presence and increasing consumer preference. Notably, PureFire's sales figures have shown a consistent upward trend, aligning with its improved ranking. In comparison, LowKey, which started at 27th in September, experienced fluctuations, ultimately ranking 40th in December, suggesting potential volatility in its market standing. Meanwhile, Station House maintained a relatively stable position around the 39th mark, indicating steady performance but not matching PureFire's dynamic growth. Additionally, Nugz (Canada) entered the top 50 in November and improved slightly by December, showing potential but still trailing behind PureFire's momentum. These insights highlight PureFire's successful strategies in capturing market share and enhancing brand visibility in the competitive landscape of British Columbia's Flower category.
Notable Products
In December 2025, Cocobamba (7g) maintained its position as the top-selling product for PureFire, continuing its streak from October and November. The Hybrid Craft Pre-Roll 5-Pack (2.5g) rose to the second position, improving from third place in November, with notable sales reaching 880 units. Day Tripper Pre-Roll 5-Pack (2.5g) dropped to third place, down from its second-place ranking in the previous two months, indicating a slight decline in its sales momentum. Twisted Runtz Pre-Roll 3-Pack (3g) climbed to fourth place, showcasing a positive trend from its absence in the October rankings. Lastly, Peyote Kush Cake (7g) entered the top five for the first time, highlighting its growing popularity among consumers.
Top Selling Cannabis Brands
Data for this report comes from real-time sales reporting by participating cannabis retailers via their point-of-sale systems, which are linked up with Headset’s business intelligence software. Headset’s data is very reliable, as it comes digitally direct from our partner retailers. However, the potential does exist for misreporting in the instance of duplicates, incorrectly classified products, inaccurate entry of products into point-of-sale systems, or even simple human error at the point of purchase. Thus, there is a slight margin of error to consider. Brands listed on this page are ranked in the top twenty within the market and product category by total retail sales volume.

