Mar-2026
Sales
Trend
6-Month
Product Count
SKUs
Avg Price
YoY Sales Change
YoY Price Change
Market Insights Snapshot
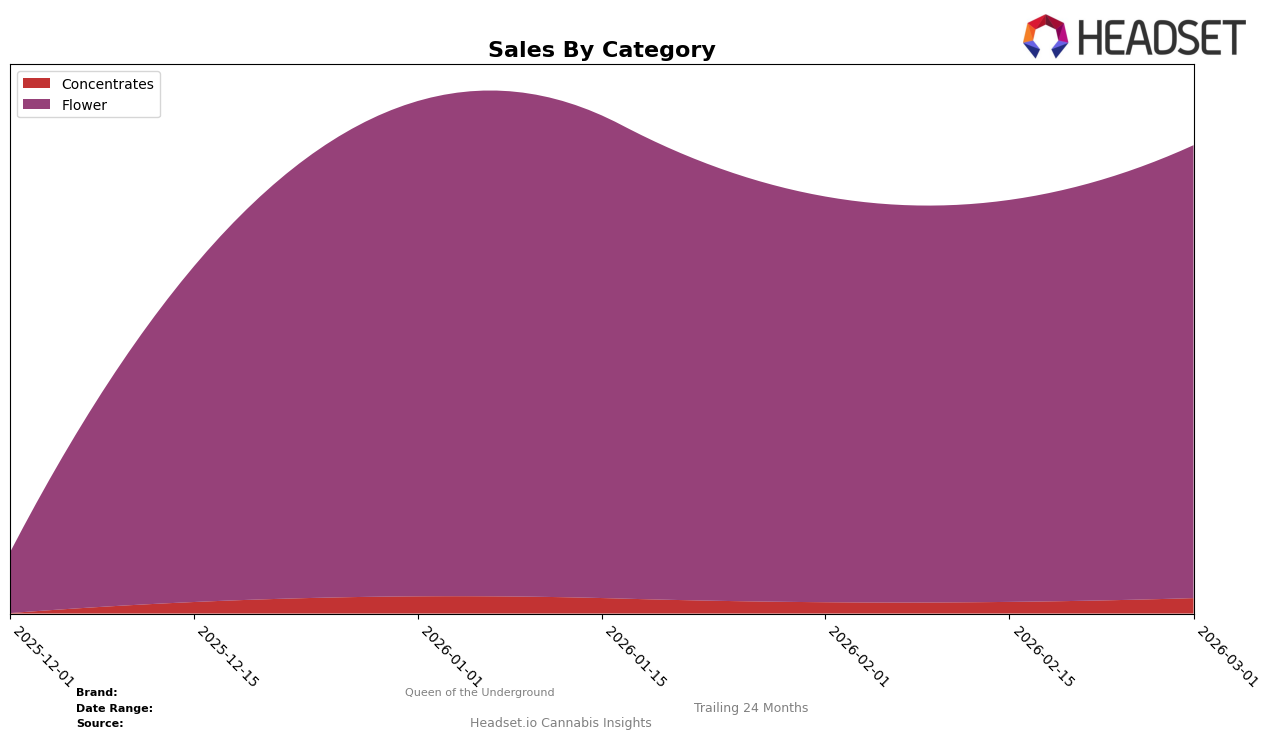
Queen of the Underground has shown a dynamic performance across various categories and regions over the past few months. In the Ontario market, the brand's presence in the Concentrates category has seen fluctuations, with a notable absence from the top 30 rankings in December 2025, suggesting a challenging period. However, by March 2026, they had consistently held onto the 50th rank, indicating a potential stabilization or slight improvement. This pattern of movement could signify strategic adjustments or market conditions impacting their standing.
In contrast, Queen of the Underground's performance in the Flower category in Ontario has been more robust. Starting from a relatively low 88th rank in December 2025, the brand made a significant leap to 25th in January 2026. This upward trend continued into February and March, with the brand maintaining a strong position in the high 20s. Such an improvement suggests effective strategies in product offerings or marketing that resonate well with consumers. This positive trajectory in the Flower category could be a focal point for their growth strategy in the coming months.
Competitive Landscape
In the competitive landscape of the Flower category in Ontario, Queen of the Underground has shown a remarkable improvement in its market position over the past few months. Starting from a rank of 88 in December 2025, the brand made a significant leap to rank 25 by January 2026, indicating a strong upward trajectory in its market presence. However, the subsequent months saw a slight fluctuation, with ranks of 28 in February and 26 in March 2026. This fluctuation could be attributed to the competitive pressure from brands like The Loud Plug, which maintained a higher rank despite a downward trend from 19 in December to 27 in March. Similarly, Pure Laine and Woody Nelson have been consistently performing, with Pure Laine starting at rank 21 and ending at 24, while Woody Nelson improved from 27 to 25 over the same period. These dynamics suggest that while Queen of the Underground has made substantial gains, maintaining its position will require strategic efforts to counteract the steady performances of its competitors.

Notable Products
In March 2026, Bubblegum 7g emerged as the top-performing product for Queen of the Underground, reclaiming its number one rank with sales reaching 2,733 units. Candy Apple 7g followed closely, maintaining a strong second position after leading in February. Bubblegum 28g showed resilience by climbing back to the third spot, while Candy Apple 28g slipped to fourth. Emerald Cut Diamonds 1g consistently held the fifth position across the months. Notably, Bubblegum 7g and Candy Apple 7g have consistently dominated the Flower category, showcasing a fierce competition for the top ranks.
Top Selling Cannabis Brands
Data for this report comes from real-time sales reporting by participating cannabis retailers via their point-of-sale systems, which are linked up with Headset’s business intelligence software. Headset’s data is very reliable, as it comes digitally direct from our partner retailers. However, the potential does exist for misreporting in the instance of duplicates, incorrectly classified products, inaccurate entry of products into point-of-sale systems, or even simple human error at the point of purchase. Thus, there is a slight margin of error to consider. Brands listed on this page are ranked in the top twenty within the market and product category by total retail sales volume.

