.svg)

Aug-2026
Sales
Trend
6-Month
Product Count
SKUs
Avg Price
YoY Sales Change
YoY Price Change


Where to Buy
Ratio (MO) is stocked at 93 licensed dispensaries across Missouri, with the deepest coverage in Kansas City, St. Louis, Joplin, Branson, and Columbia. Search by ZIP code or city below to find the closest one, or filter by product type if you are after a specific format.
Market Insights Snapshot
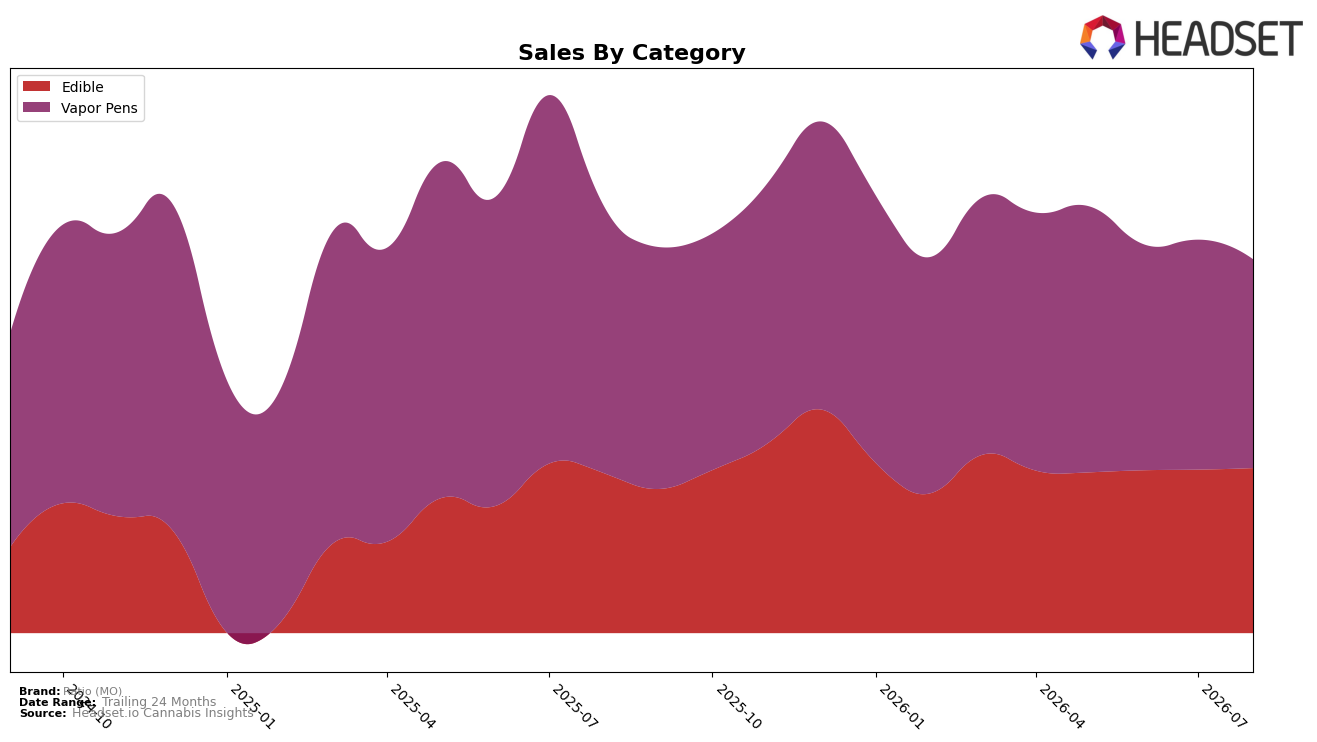
In August 2026, Ratio (MO) concentrated 54.52% of sales in Vapor Pens and 45.48% in Edible, with Vapor Pens down 18.06% year over year and 7.39% month over month while Edible grew 2.38% year over year and 0.70% month over month; the brand’s overall sales declined 9.88% year over year as average price slipped 1.33%. Within MO, the Vapor Pens focus coincided with a category rank position of 59, implying that heavier exposure to a contracting segment is dragging aggregate results despite stability in Edible, so the mix is tilting the brand toward underperformance unless allocation shifts.
The divergence—Vapor Pens losing share momentum against Edible’s incremental gains—implies a defensive repositioning opportunity toward Edible where unit velocity can benefit from a $19.84 average price versus $32.48 in Vapor Pens and reduce sensitivity to Vapor Pens’ rank headwinds at 59. Given a 24‑month sales change of −8.92% alongside August 2026 month-over-month declines concentrated in Vapor Pens at −7.39% versus Edible’s +0.70%, the pattern suggests reallocating assortment and promotion toward Edible to stabilize topline while treating Vapor Pens as a selective, rank-aware play rather than a volume anchor.
Competitive Landscape
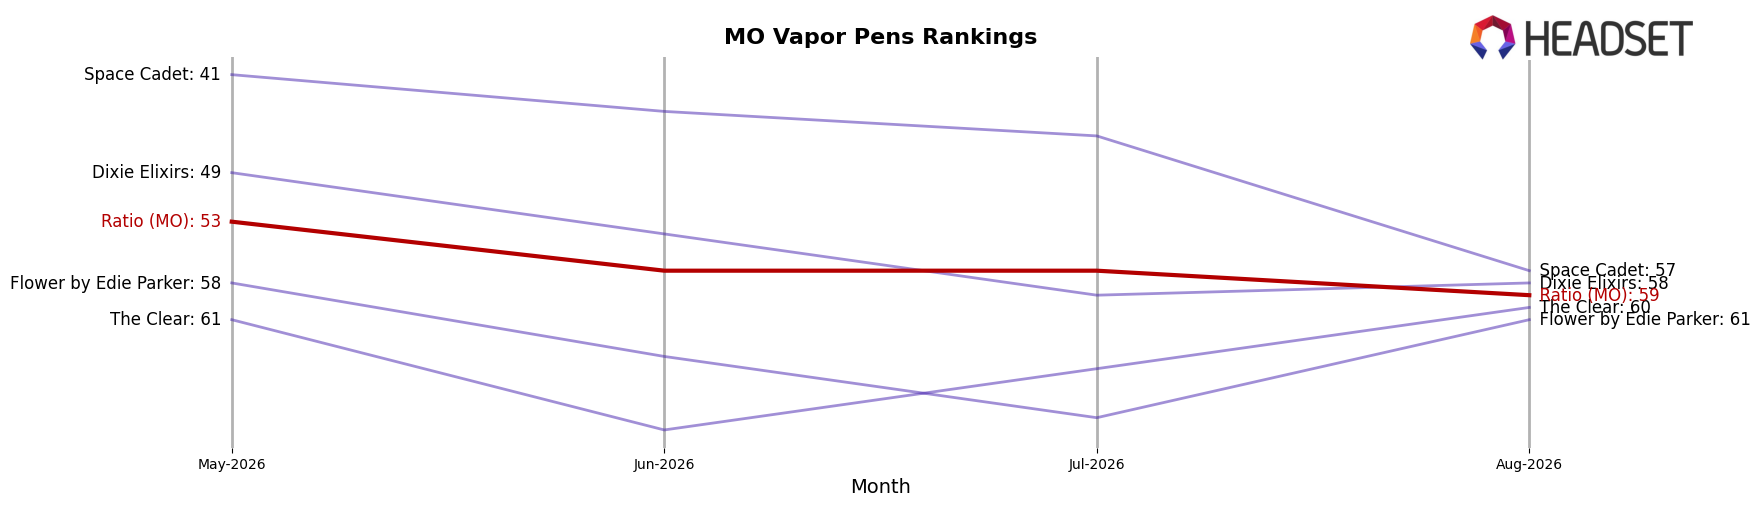
Ratio (MO) sits at rank 59 in August 2026 in MO Vapor Pens, down 9 positions year over year from rank 50 and 6 positions versus three months ago at rank 53; this contrasts with Illicit / Illicit Gardens moving from rank 2 to rank 1 alongside a 19.6% YoY sales lift, and Good Day Farm advancing from rank 7 to rank 3 with a 59.1% YoY sales increase, indicating that peer gains are outpacing Ratio (MO)’s slide away from its peak rank 43 in July 2025; the pattern implies that unless Ratio (MO) reverses the 9-position YoY decline and the 6-position three‑month drop, competitive share will continue consolidating among faster‑rising leaders.
Notable Products
CBD/THC 1:20 Active Microdose Mints 40-Pack (5mg CBD, 100mg THC) posted the steepest decline at -20.3% MoM while slipping to rank 2, contrasting with the category leader CBD/THC 1:1 Balance Microdose Peppermint Mints 40-Pack (100mg CBD, 100mg THC) up 48.3% at rank 1. Vapor Pens showed mixed momentum, with Balance - CBD/THC 1:1 Cherry Peppermint Distillate Disposable (0.5g) rising 6.7% at rank 3 as Active - CBD/THC 1:20 Lemon Verbena Distillate Disposable (0.5g) fell -12.0% at rank 5, indicating demand is tilting toward mid-ratio formats over high-THC variants. Four of the top ten are Edible SKUs, yet two Edible ratios contracted by -14.0% and -4.1% alongside the +48.3% gainer, implying a rotation within Edibles toward balanced 1:1 profiles rather than uniform category growth. This pattern points to Ratio (MO) leaning into balanced formulations as a defensible growth lane, with August 2026 mix signaling reallocation potential away from 1:20 offerings toward 1:1 and 1:5 where rank stability and MoM expansion are clustering.
Top Selling Cannabis Brands






Data for this report comes from real-time sales reporting by participating cannabis retailers via their point-of-sale systems, which are linked up with Headset’s business intelligence software. Headset’s data is very reliable, as it comes digitally direct from our partner retailers. However, the potential does exist for misreporting in the instance of duplicates, incorrectly classified products, inaccurate entry of products into point-of-sale systems, or even simple human error at the point of purchase. Thus, there is a slight margin of error to consider. Brands listed on this page are ranked in the top twenty within the market and product category by total retail sales volume.

