.svg)

Sep-2026
Sales
Trend
6-Month
Product Count
SKUs
Avg Price
YoY Sales Change
YoY Price Change


Market Insights Snapshot
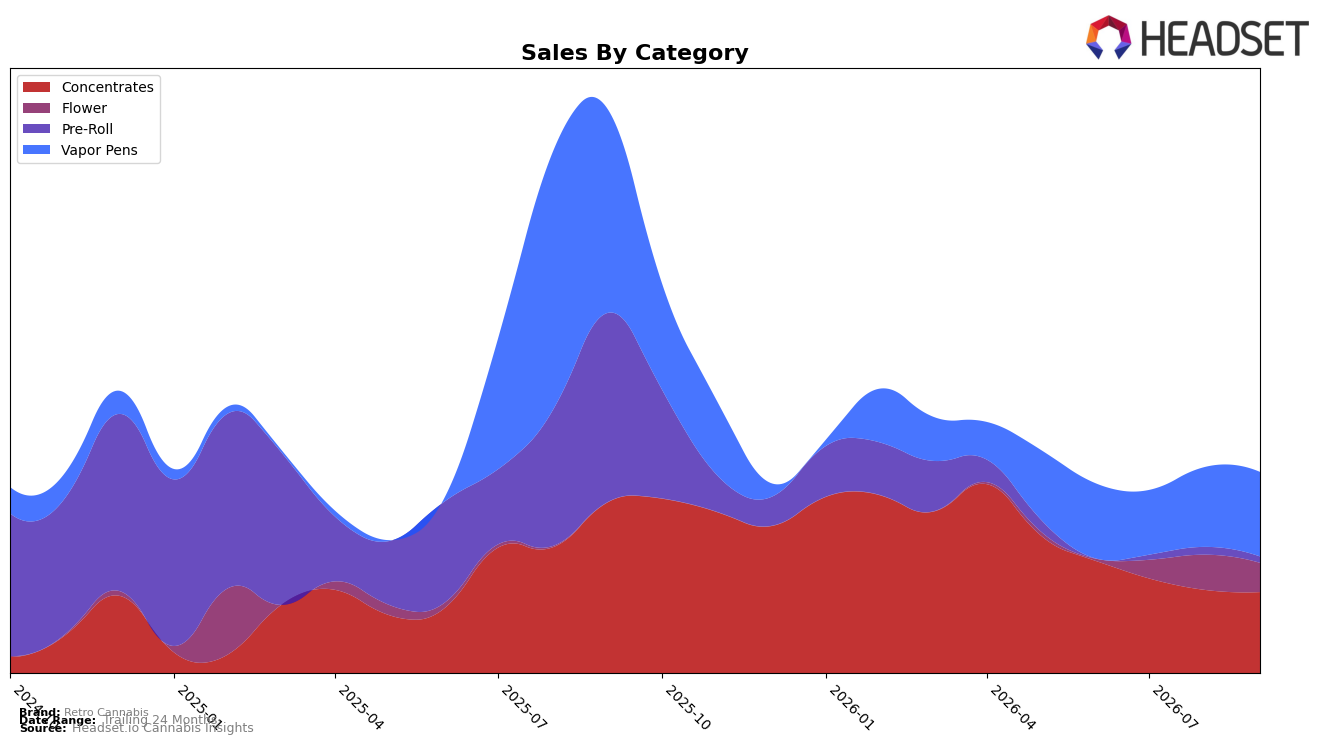
In September 2026, Retro Cannabis concentrated 42.06% of sales in Vapor Pens and 40.41% in Concentrates, while Flower held 14.47% and Pre-Roll just 3.06%; this mix coincided with a brand-level year-over-year decline of 64.36% alongside a 25.48% increase versus 24 months prior. Within categories, Vapor Pens fell 58.39% year over year but rose 5.90% month over month, whereas Concentrates declined 52.63% year over year and slipped 2.66% month over month; Pre-Roll contracted 96.75% year over year and 18.93% month over month. The tilt toward higher-priced inhalables is reinforced by a 5.50% rise in average price to $29.36, while Flower’s 16.92% month-over-month drop and a null year-over-year reading suggest a newer or discontinuous SKU set; the pattern implies reliance on premium inhalables for short-term recovery and exposure to downside where low-price formats are absent.
Positionally, anchoring 82.47% of volume in Vapor Pens and Concentrates places Retro Cannabis in a higher-ticket, potency-led frame, yet Vapor Pens sitting at a provincial rank of 40 in Saskatchewan and a 5.90% month-over-month uptick indicates share can be recaptured faster in that lane than in Flower, which declined 16.92% month over month. The 3.06% Pre-Roll share and a 96.75% year-over-year contraction reduce the brand’s basket-entry utility, while Concentrates’ 2.66% month-over-month slip beside Vapor Pens’ month-over-month gain points to cannibalization risk between premium inhalables. This configuration implies Retro Cannabis can trade on price-insensitive segments to stabilize near term, but sustained rank improvement requires widening entry points via Flower or Pre-Roll while preserving the Vapor Pen recovery signal.
Competitive Landscape
Retro Cannabis sits at rank #40 in SK Vapor Pens in September 2026, down 14 positions year over year from #26, and 3 spots below its June 2026 position at #43 improved to #40, while the brand’s peak of #26 in September 2025 underscores a two-year slide; meanwhile, Spinach held #1 after rising from #2 year over year with 74.5% YoY sales growth, and General Admission advanced to #4 from #14 alongside 231.5% YoY sales growth, indicating that category leaders are consolidating share as Retro Cannabis loses rank momentum—implying that without a mix or pricing reset timed to peak seasonal demand, continued share erosion is the base case.

Notable Products
Ghost Train Haze Cherry Co2 Oil Syringe (1g) posted the largest month-over-month gain at +50.0% and climbed to rank 3, while Potent Pete Infused Pre-Roll 3-Pack (1.5g) collapsed by -75.6% and slid to rank 9, indicating a sharp split between concentrate momentum and pre-roll retrenchment. CBD/THC 1:1 Perfect Harmony Full Spectrum Cartridge (1g) held rank 1 despite a -3.7% dip, whereas Blockbuster Nights (3.5g) fell -16.9% to rank 2, pointing to relative stability in Vapor Pens versus a pullback in Flower. With three Vapor Pen SKUs in the top six and two Concentrates in the top seven, September 2026 skews toward inhalable oils, implying a shift in Retro Cannabis’s commercial focus toward higher-velocity oil formats and away from pre-rolls.
Top Selling Cannabis Brands






Data for this report comes from real-time sales reporting by participating cannabis retailers via their point-of-sale systems, which are linked up with Headset’s business intelligence software. Headset’s data is very reliable, as it comes digitally direct from our partner retailers. However, the potential does exist for misreporting in the instance of duplicates, incorrectly classified products, inaccurate entry of products into point-of-sale systems, or even simple human error at the point of purchase. Thus, there is a slight margin of error to consider. Brands listed on this page are ranked in the top twenty within the market and product category by total retail sales volume.

