Jun-2026
Sales
Trend
6-Month
Product Count
SKUs
Avg Price
YoY Sales Change
YoY Price Change
Market Insights Snapshot
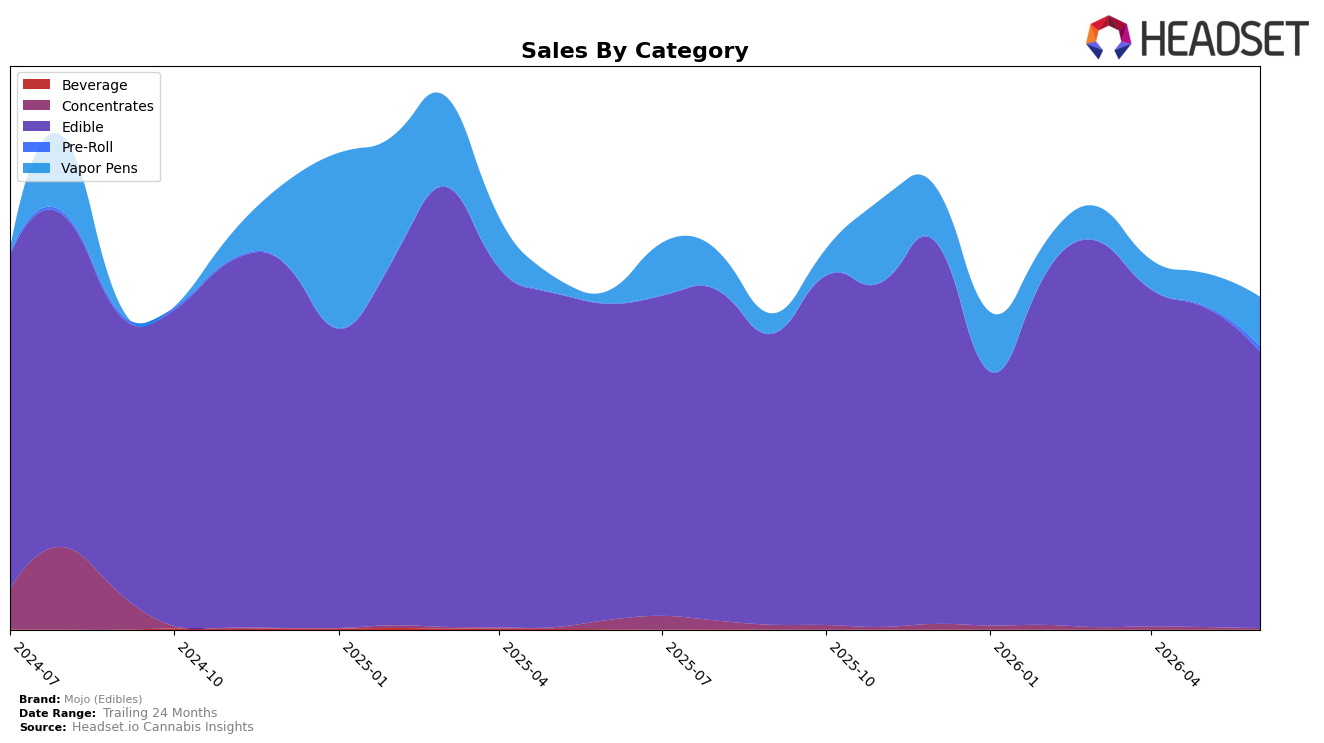
Mojo (Edibles) concentrated 83.30% of sales in Edible during June 2026, down as Edible declined 12.62% year over year and 13.56% month over month, while Vapor Pens expanded to 14.79% share with 306.22% YoY growth and 51.72% MoM growth. Pre-Roll, though only 1.55% share, accelerated 2,456.36% YoY and 333.28% MoM, as Concentrates contracted to 0.36% share with an 86.61% YoY drop and 45.47% MoM decline. With average price up 16.41% YoY to $10.31 and overall brand sales down 1.78% YoY, the mix shift implies volume leakage from Edible offset by trial or trade-up in non-core formats. The pattern suggests Mojo (Edibles) is reallocating demand from a shrinking Edible base into faster-growing Vapor Pens and opportunistic Pre-Roll, changing category dependence while holding an Edible rank of 20 in Michigan.
The surge in Vapor Pens (+306.22% YoY; +51.72% MoM) and spike in Pre-Roll (+2,456.36% YoY; +333.28% MoM) alongside Edible declines (-12.62% YoY; -13.56% MoM) implies a defensive diversification play to stabilize revenue against Edible softness, even as the brand’s average price rose 16.41% YoY. With Edible still 83.30% of mix and a rank of 20 in Michigan, the brand remains anchored in Edibles but is testing adjacency-led positioning; if Vapor Pens grow another 50%+ month over month while Edibles fall by low double digits, near-term share of wallet could tilt toward inhalables, recasting Mojo (Edibles) as a cross-format value seeker rather than a single-category specialist.
Competitive Landscape
Mojo (Edibles) sits at rank #20 in MI Edible in June 2026, down 4 positions from #16 year over year, and 7 places below its March 2026 peak at #13; by contrast, Wyld held #1 both this year and last despite a -13.4% YoY sales change, while MKX Oil Company maintained a top-3 slot at #3 with +10.8% YoY sales growth. The slide from #13 in March 2026 to #20 in June 2026 coincides with Camino climbing from #5 to #4 (+15.7% YoY) and Good Tide slipping from #4 to #5 (-16.2% YoY), implying Mojo (Edibles) is losing relative velocity in a reshuffling top tier and must stabilize monthly rank to avoid drifting further from the #10–#15 consideration set.

Notable Products
Caramel Filled Milk Chocolate Bites 10-Pack (200mg) posted the steepest decline at -25.4% while sliding to rank 4, and Crispy Wafer High Dose Chocolate Bites (200mg) fell -30.3% to rank 6, signaling contraction in higher-dose chocolate formats despite top-tier placement. Nuggy Caramel Peanut Bites Chocolates 10-Pack (200mg) retained rank 1 even with a -17.2% month-over-month drop and an estimated $46,478 in June 2026 sales, whereas Sativa Mini Peppermint Patties Chocolate 10-Pack (200mg) in rank 2 inched up just +0.7%, implying leadership is being maintained by incumbents rather than new momentum. With Cookies & Cream Chocolate Bites (200mg) up +12.3% in rank 3 and Cookie Bars Chocolate Bites (200mg) up +21.5% in rank 5, and eight of the top ten being chocolate bite SKUs, the product mix is tilting toward classic flavor profiles over experimental or high-dose variants.
Top Selling Cannabis Brands
Data for this report comes from real-time sales reporting by participating cannabis retailers via their point-of-sale systems, which are linked up with Headset’s business intelligence software. Headset’s data is very reliable, as it comes digitally direct from our partner retailers. However, the potential does exist for misreporting in the instance of duplicates, incorrectly classified products, inaccurate entry of products into point-of-sale systems, or even simple human error at the point of purchase. Thus, there is a slight margin of error to consider. Brands listed on this page are ranked in the top twenty within the market and product category by total retail sales volume.

