.svg)


Market Insights Snapshot
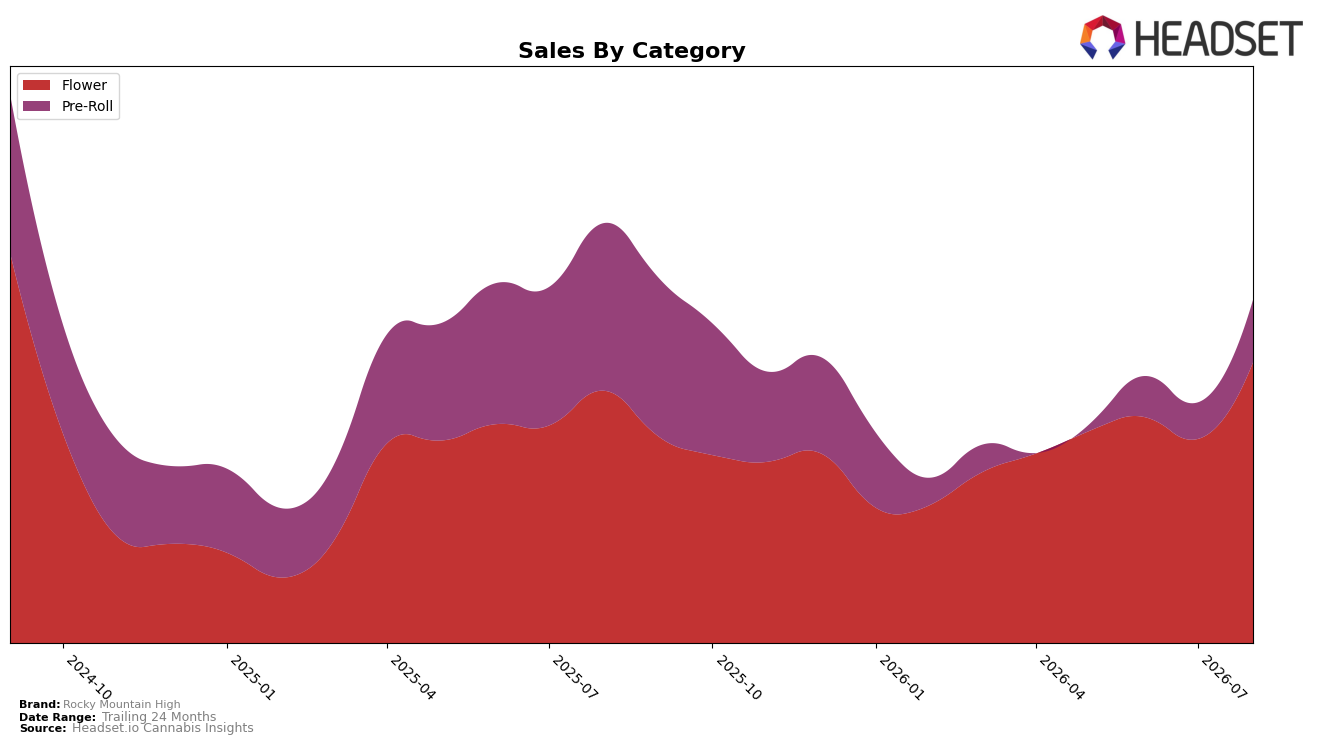
In August 2026, Rocky Mountain High concentrated 73.98% of sales in Flower, up 29.48% month over month and 9.26% year over year, while Pre-Roll held 26.02% share with a 28.06% MoM lift but a 47.00% YoY decline; this mix shift coincided with a 40.85% YoY increase in average price and an overall brand sales contraction of 14.39% YoY. Within Colorado Flower, the brand sat at rank 41 even as category sales rose, and the divergence between a YoY gain in Flower and a YoY drop in Pre-Roll indicates reliance on fewer, higher-priced Flower units to offset a volume pullback in value-oriented Pre-Rolls.
The acceleration in Flower share alongside a 29.48% MoM gain, paired with a 28.06% MoM rebound in Pre-Roll but a 47.00% YoY Pre-Roll decline, implies a positioning tilt toward premiumized Flower that trades price for volume and leaves the brand less insulated in down months. With August 2026 average price up 40.85% YoY while total brand sales fell 14.39% YoY and Flower rank fixed at 41 in Colorado, the pattern suggests the current pricing and assortment strategy lifts short-term revenue per unit but caps category reach, pointing to a need for calibrated Pre-Roll depth or moderated Flower price points to regain rank mobility.
Competitive Landscape
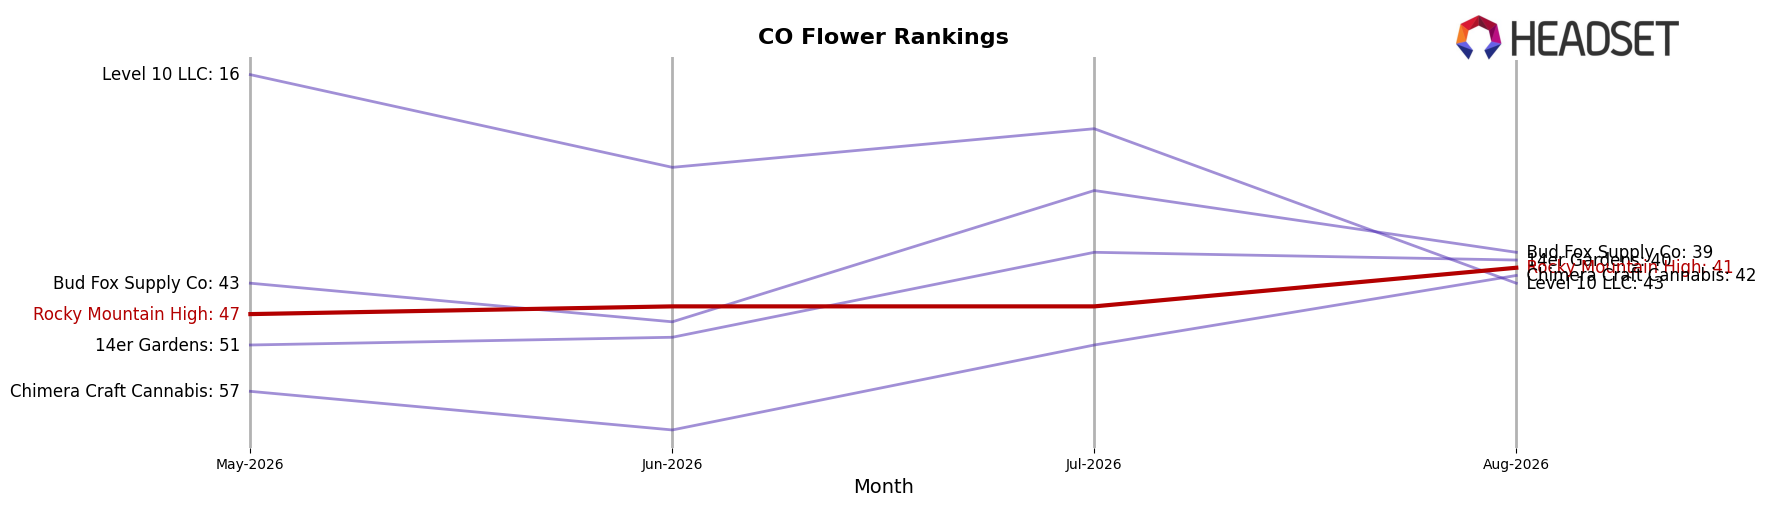
Rocky Mountain High sits at rank 41 in Colorado Flower in August 2026, improving 10 positions from rank 51 year over year, and up 6 spots from rank 47 in May 2026; however, the brand remains 11 places below its peak rank 30 from August 2024 and trails the current top tier where Seed & Strain Cannabis Co. rose to rank 1 from rank 2 while Green Label Cannabis slipped to rank 2 from rank 1. Against this backdrop, Green Dot Labs climbed to rank 3 from rank 5 as Rocky Mountain High advanced only 6 ranks over three months, indicating the category’s leaders are widening the distance in ladder movement and that Rocky Mountain High’s trajectory suggests incremental share recovery rather than a return to top-30 presence without a step-change in velocity.
Notable Products
Bubba Fett Pre-Roll (1g) led August 2026 with a +191% month-over-month surge and climbed to rank 2, while Chem De La Chem Pre-Roll (0.5g) fell -77% and slid to rank 9. Animal Face x Kush Mints #11 Pre-Roll (0.5g) grew +35.7% to hold rank 1, contrasting with Bubble Gum Pre-Roll (1g) at -8.2% in rank 3. Katsu Le Moon Pre-Roll 5-Pack (2.5g) advanced +57.8% at rank 5, and Blueberry Muffin B-Buds (1g) declined -19.8% at rank 7, with Watermelonz x GAK Pre-Roll 5-Pack (2.5g) down -15.5% at rank 6. With eight of the top ten positioned in Pre-Roll and only one Flower SKU, the mix signals a pivot toward multi-pack and single-gram pre-rolls as the primary commercial engine, concentrating spend away from Flower despite $14,493 in Bubba Fett Pre-Roll (1g) sales.
Top Selling Cannabis Brands






Data for this report comes from real-time sales reporting by participating cannabis retailers via their point-of-sale systems, which are linked up with Headset’s business intelligence software. Headset’s data is very reliable, as it comes digitally direct from our partner retailers. However, the potential does exist for misreporting in the instance of duplicates, incorrectly classified products, inaccurate entry of products into point-of-sale systems, or even simple human error at the point of purchase. Thus, there is a slight margin of error to consider. Brands listed on this page are ranked in the top twenty within the market and product category by total retail sales volume.

